

Cette page a été traduite automatiquement et pourrait contenir des erreurs
Cette page a été traduite automatiquement et pourrait contenir des erreurs
La version 2.34 de DHIS2 est disponible avec de nombreuses nouvelles fonctionnalités, applications, améliorations et corrections de bugs. Sur cette page, vous pouvez trouver des informations sur cette version du logiciel, y compris des descriptions de fonctionnalités, des liens vers la documentation technique et plus encore.
Découvrez les points forts des nouvelles fonctionnalités de cette version du DHIS2 grâce à notre série de vidéos « Feature Spotlight ».
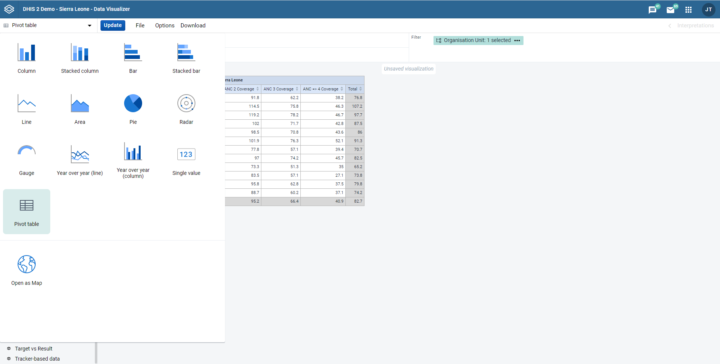
L’application Visualiseur de données prend désormais en charge les tableaux croisés dynamiques, ce qui signifie que les fonctionnalités de l’application de tableaux croisés dynamiques sont fusionnées dans l’application Visualiseur de données. Un tableau croisé dynamique est désormais un type de visualisation supplémentaire dans l’application Visualiseur de données. Les utilisateurs bénéficient ainsi d’une expérience plus intuitive pour la création de tableaux croisés dynamiques et peuvent passer plus facilement d’un tableau croisé dynamique à un autre type de graphique. Les performances des tableaux croisés dynamiques sont également considérablement améliorées, ce qui permet de réaliser de très grands tableaux croisés dynamiques contenant au moins trois fois plus de données que l’application classique de tableau croisé dynamique.
[ Vidéo ][ Capture d’écran 1 | 2 | 3 ][ Jira ]
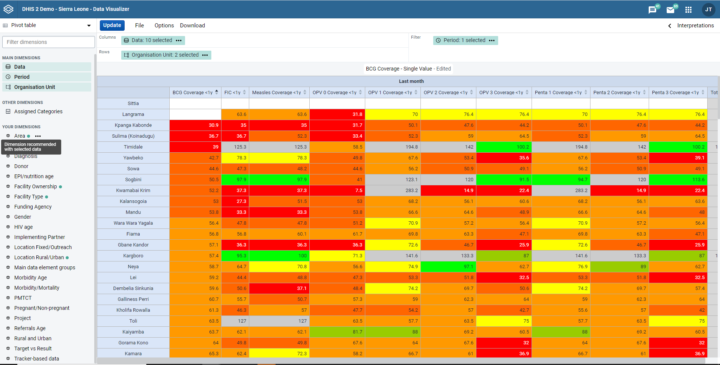
Dans l’application Visualiseur de données, les tableaux croisés dynamiques prennent désormais en charge les « recommandations de dimension », ce qui signifie que les dimensions pertinentes pour les éléments de données sélectionnés seront indiquées dans le panneau de gauche par un point vert.
[ Vidéo ] [ Capture d’écran 1 ]
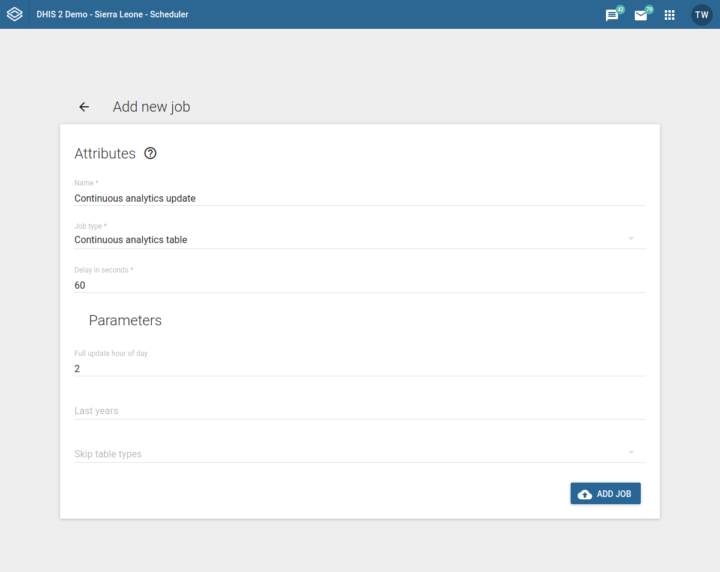
Le planificateur de tables d’analyse prend désormais en charge les mises à jour continues des tables d’analyse, offrant ainsi une expérience « d’analyse en temps réel ». Le délai entre la saisie des données et leur visibilité dans les applications d’analyse peut désormais être estimé à quelques secondes, contre plusieurs heures ou un jour auparavant. Essentiellement, une nouvelle partition de table contenant les données les plus récentes est introduite, ce qui permet des mises à jour plus rapides. Configurez-le dans l’application Planificateur en sélectionnant le type de tâche Table d’analyse continue. Le champ Délai en secondes indique le nombre de secondes entre chaque mise à jour des dernières données. Le champ Heure de la mise à jour complète fait référence à l’heure de la journée à laquelle la mise à jour complète de la table d’analyse doit être effectuée.
[ Capture d’écran 1 ][ Docs ]

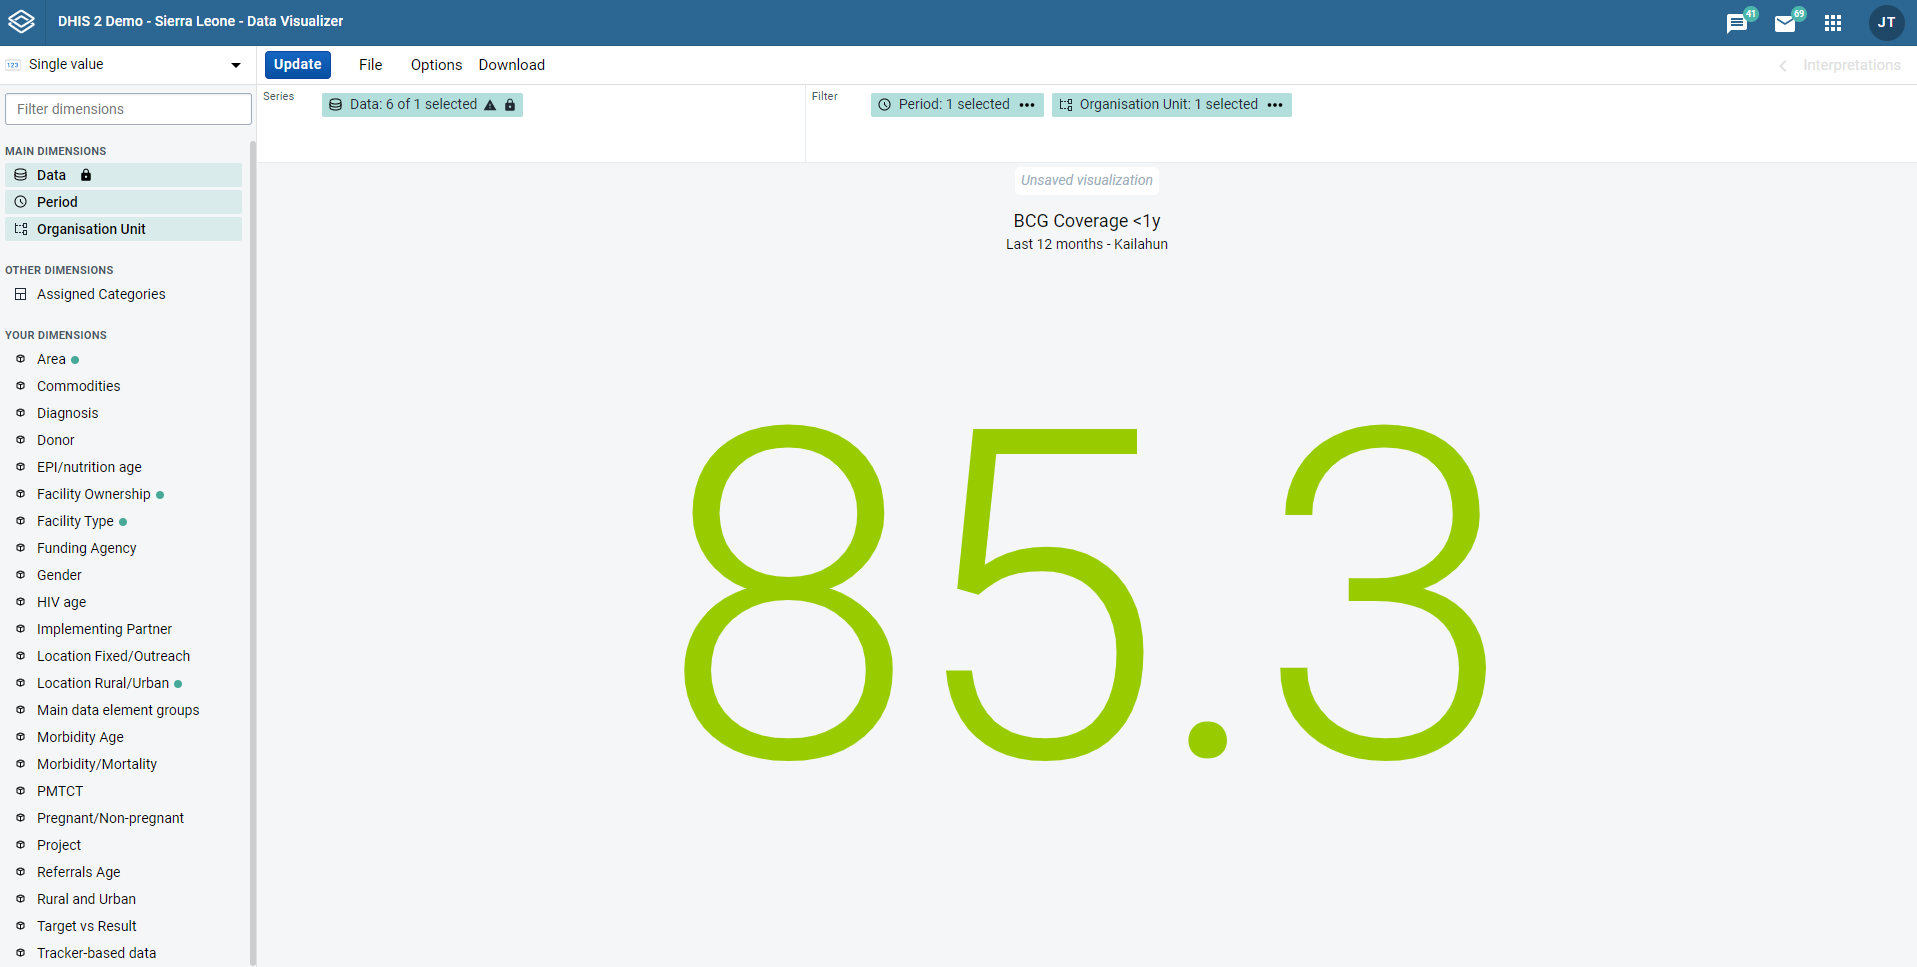
Des légendes peuvent désormais être ajoutées aux types de graphiques à valeur unique. La couleur du texte de la valeur est déterminée par la légende dans laquelle la valeur s’inscrit. Cela permet aux utilisateurs de communiquer plus efficacement la performance relative des valeurs.
[ Capture d’écran 1 ][ Jira 1 ]
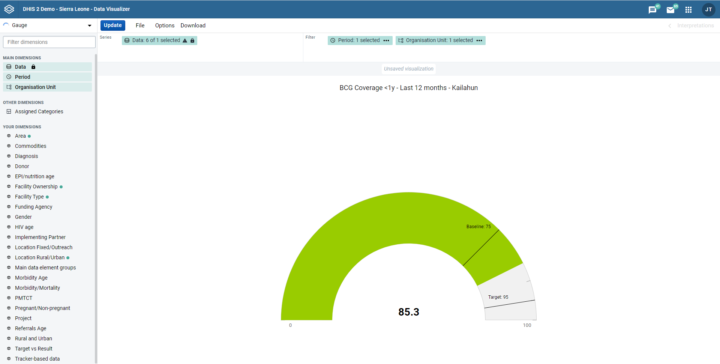
L’utilité des cartes de jauge a été considérablement améliorée. Désormais, un graphique de jauge peut inclure des lignes de base et des lignes cibles, une légende qui modifie la couleur du graphique en fonction de la valeur affichée, ainsi que des plages de données minimales et maximales.
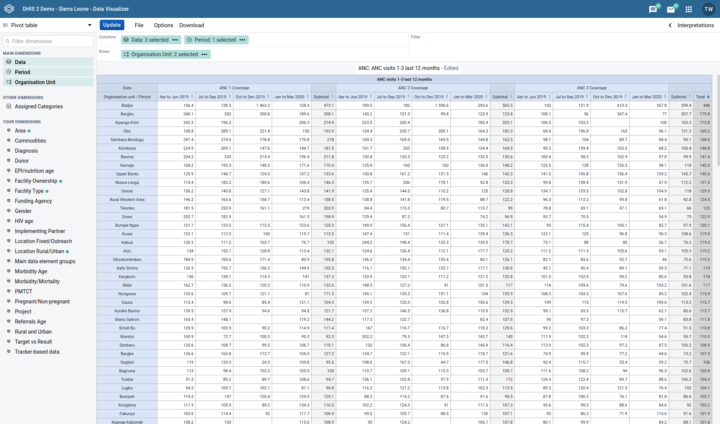
Vous pouvez désormais trier par colonne de sous-total et de total dans les tableaux croisés dynamiques.
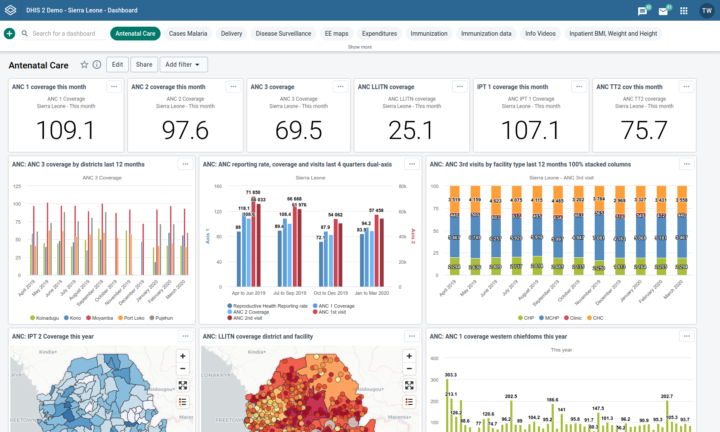
Chaque élément du tableau de bord dispose d’un habillage de texte pour les noms longs. Toutes les options du tableau de bord sont désormais disponibles sous forme de menu et non plus d’icônes, ce qui laisse plus d’espace pour le titre et rend les titres plus visibles dans le tableau de bord.
Désormais, dans l’application du visualiseur de données, lorsque l’utilisateur recherche une visualisation enregistrée, le type de visualisation sera affiché et les utilisateurs pourront filtrer par type de visualisation.
[ Vidéo ][ Capture d’écran 1 ][ Jira 1 ]
La mise en cache progressive réduit le temps de rendu des tableaux de bord et accélère les analyses en créant une nouvelle couche de cache. Cela permet essentiellement de visualiser les données dans le système d’analyse immédiatement après leur saisie, sans avoir à exécuter les tables d’analyse.
[ Jira ]
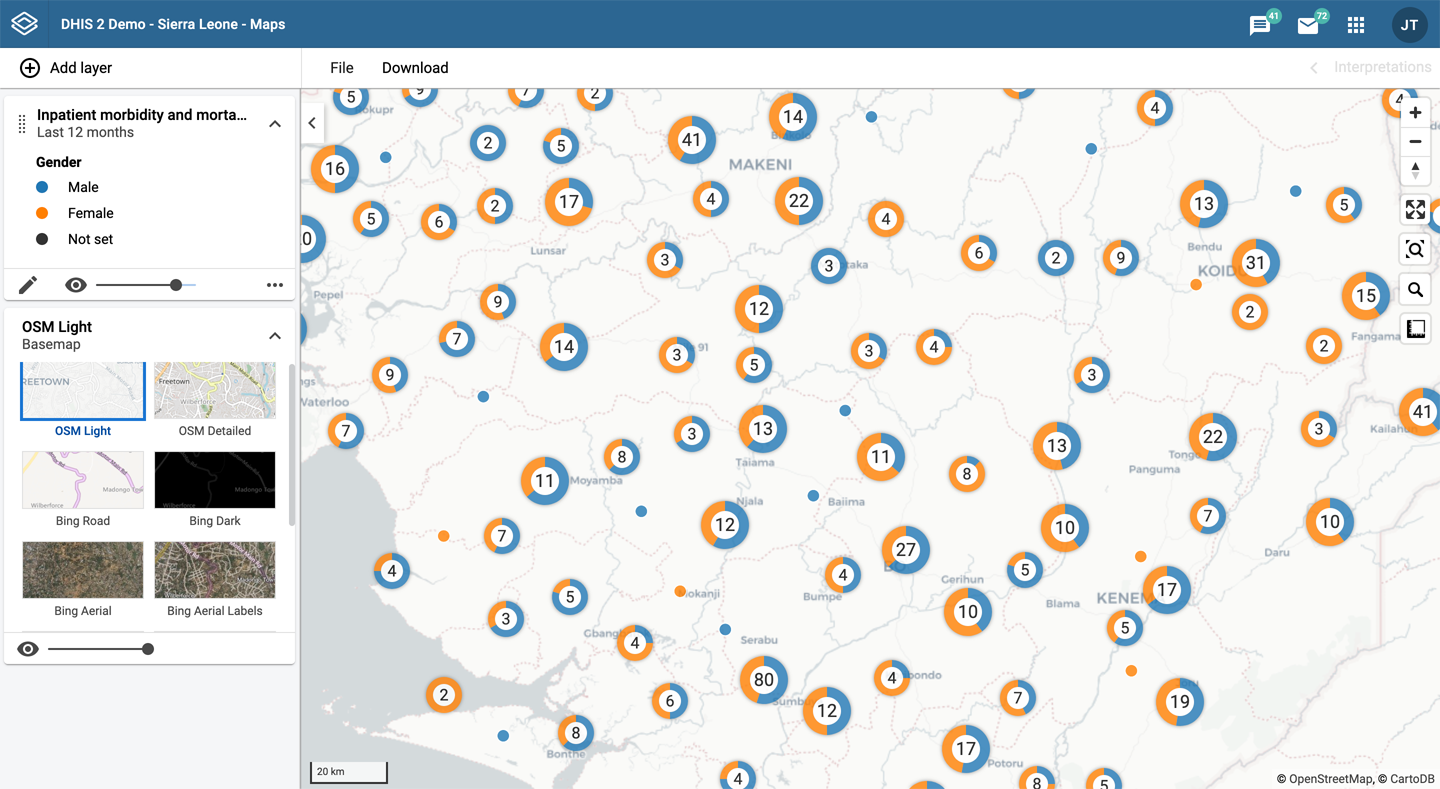
Le moteur de cartographie de la version 2.34 est entièrement nouveau et basé sur la technologie WebGL qui est beaucoup plus performante que la solution précédente. Les fonctionnalités clés suivantes sont désormais disponibles dans Maps :
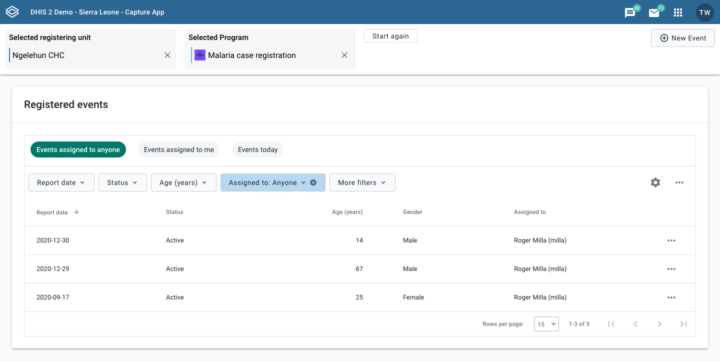
Dans l’app de capture, il est désormais possible d’enregistrer et de partager des vues de listes/filtres d’événements prédéfinis et paramétrés. Un utilisateur peut enregistrer un filtre nommé basé sur n’importe quel attribut filtrable comme les valeurs des données d’événements, les dates d’événements, les assignés, etc. Il peut s’agir d’un filtre privé ou partagé afin que d’autres utilisateurs puissent le voir et l’utiliser. Ces filtres peuvent notamment servir à créer une liste de travail par défaut des événements attribués à l’utilisateur connecté.
[ Capture d’écran 1 ][ Docs ][ Jira]
Il est désormais possible pour un utilisateur de rechercher et de lier une relation à n’importe quelle instance d’entité suivie dans son champ de recherche. Auparavant, il n’était possible de rechercher et de lier des relations qu’au sein de l’unité d’organisation de l’utilisateur. La recherche entre différentes organisations est utile dans le cadre de la recherche de contacts Covid-19 lorsque les contacts peuvent vivre dans une autre partie du pays. Cette fonctionnalité a également été reportée dans la version 2.33.
[ Capture d’écran 1 ][ Docs 1 ][ Jira 1 ]
Une piste d’audit est désormais stockée pour tous les types de métadonnées et de données. La piste d’audit est activée par défaut et peut être configurée dans le fichier de configuration dhis.conf. La solution est centralisée et repose sur le courtier en messages asynchrones Apache ActiveMQ Artemis. La solution d’audit couvre les opérations de création, de lecture, de mise à jour et de suppression des métadonnées, des données agrégées et des données des Trackers. Les journaux d’audit peuvent actuellement être extraits de la table d’audit de la base de données DHIS2.
Une série d’améliorations ont été apportées en matière de performance et de sécurité :
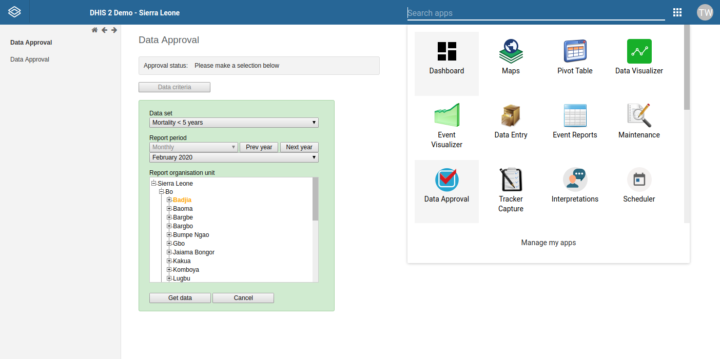
La fonctionnalité d’approbation des données est réintroduite sous la forme d’une application distincte appelée Approbation des données. Elle offre les mêmes fonctionnalités qui étaient auparavant accessibles via l’application Rapports. Il permet d’approuver les données par ensemble de données et par période. Nous travaillons sur une nouvelle application d’approbation utilisant notre nouvelle pile technologique qui prendra en charge le modèle de flux de travail d’approbation des données.
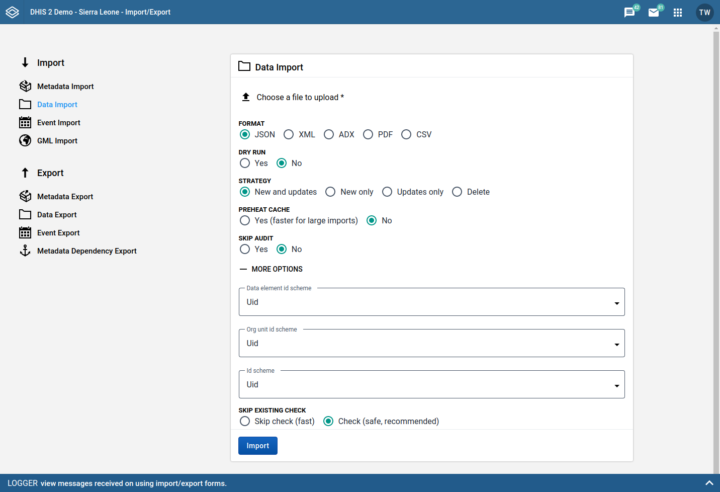
L’application d’import-export permet désormais de sélectionner des schémas d’identification basés sur des attributs pour l’importation et l’exportation de données.
[ Capture d’écran 1 ][ Jira 1 ]
L’App Store a été rebaptisé App Hub. L’App Hub a été réécrit pour améliorer la gestion des applications. L’utillisation de DHIS2 2.34 utilise par défaut le nouveau App Hub(https://apps.dhis2.org). Les applications de l’ancien App Store ont été migrées vers le nouvel App Hub dans la mesure du possible. L’ancien lien de l’App Store, utilisé par les versions précédentes de DHIS2, continuera de fonctionner, mais sera redirigé de manière transparente vers le nouveau App Hub dans un avenir proche. Les développeurs d’applications doivent désormais utiliser le nouveau App Hub pour partager leurs applications.
[ App Hub ]
Les points de terminaison reportsTables et charts ont été supprimés en faveur d’un nouveau point de terminaison consolidé pour les visualisations.
[ Docs 1 ]
Cette version du DHIS2 est compatible avec l’application Android de capture du DHIS2 version 2.1.
Cliquez sur les liens dans le tableau ci-dessous pour plus d’informations sur cette version du logiciel et pour accéder à une démo interactive.
| To find more details about... | Follow this link: |
|---|---|
| Download release and sample database | Downloads |
| Documentation and Javadocs | Documentation |
| Upgrade notes | Upgrade notes for 2.34 on Github |
| Details about each feature on JIRA (requires login) | Details on JIRA |
| Overview of issues on JIRA (requires login) | Overview on JIRA |
| Source code on Github | DHIS2 source code |
| Demo instance | Demos |
| DHIS2 community | DHIS2 Community of Practice |
![2 ]](https://s3-eu-west-1.amazonaws.com/content.dhis2.org/releases/screenshots/34/gauge_chart.png)
![3 ]](https://s3-eu-west-1.amazonaws.com/content.dhis2.org/releases/screenshots/34/map_donut_clusters.png)