
Cette page a été traduite automatiquement et pourrait contenir des erreurs
DHIS 2.27 Vue d’ensemble
Découvrez la version 2.27 de DHIS2, qui comprend de nombreuses nouvelles fonctionnalités, applications, améliorations et corrections de bugs. Sur cette page, vous pouvez trouver des informations sur cette version du logiciel, y compris des descriptions de fonctionnalités, des liens vers la documentation technique et plus encore.
Aller à une section sur cette page
Fonctionnalités d'analyse
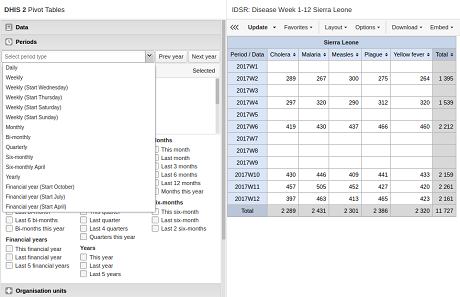
Exploration de la période et de l'unité d'organisation
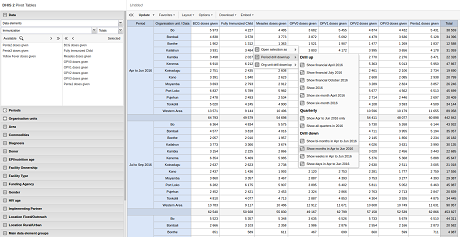
L’application Tableau croisé dynamique permet désormais d’effectuer des analyses descendantes (et ascendantes) pour les périodes et les unités d’organisation. Cela signifie que vous pouvez, par exemple, passer de périodes annuelles à des trimestres, des mois et des semaines à l’intérieur du tableau croisé dynamique. Vous pouvez également effectuer une analyse descendante à partir de l’unité d’organisation mondiale vers les pays, les provinces et les établissements.
[ Demo1 | 2 ][ Capture d’écran 1 | 2 ][Docs]
Les niveaux des unités d'organisation sous forme de colonnes
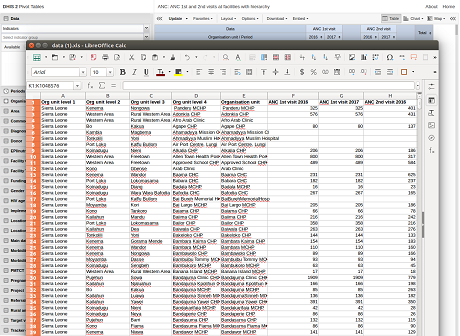
Lors du téléchargement d’un tableau croisé dynamique dont les lignes sont des unités d’organisation et dont l’option « Afficher la hiérarchie » est activée dans la boîte de dialogue des options, chaque niveau d’unité d’organisation est affiché sous la forme d’une colonne distincte. Ceci est utile, par exemple, lorsque vous créez des tableaux croisés dynamiques Excel sur un ordinateur local.
[ Capture d’écran ] [ Démo ][Documentation]
Masquer les colonnes vides
L’application Tableau croisé dynamique permet désormais de masquer les colonnes vides du tableau. Vous pouvez l’activer dans la boîte de dialogue Options du tableau.
[ Demo ][ Screenshot][Docs]
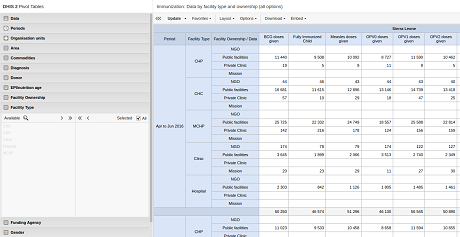
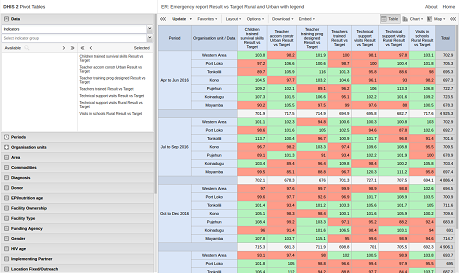
Légende par élément de données
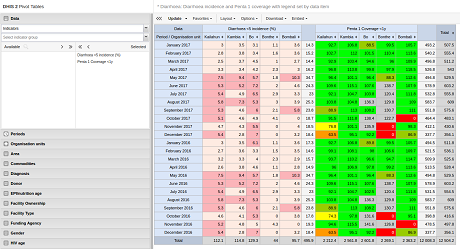
Dans l’application Tableau croisé dynamique, vous pouvez désormais colorer les cellules du tableau en fonction de chaque élément de données ou indicateur individuellement. Vous pouvez l’activer dans la boîte de dialogue Options du tableau en réglant la légende sur « Par élément de données ».
[ Démo ][ Capture d’écran 1 | 2 ][Docs]
% de lignes et de colonnes dans les tableaux croisés dynamiques
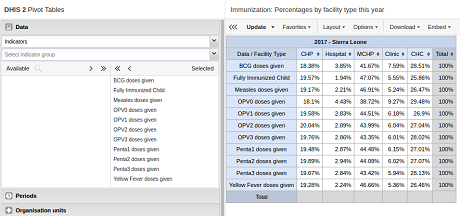
Dans l’application Tableau croisé dynamique, vous pouvez désormais afficher les valeurs en pourcentage du total des lignes ou en pourcentage du total des colonnes (au lieu de la valeur agrégée). Cela permet de voir la contribution des éléments de données, des catégories et des unités d’organisation à la valeur totale. Vous pouvez l’activer dans la boîte de dialogue Options du tableau.
[ Démonstration] [ Capture d’écran ][Docs]
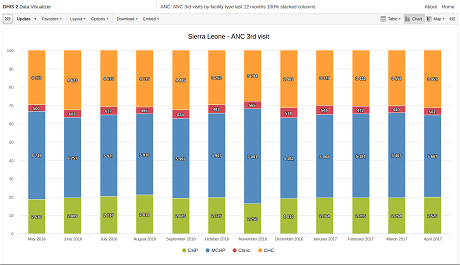
Graphiques à colonnes empilées à 100
Dans l’application Visualiseur de données, vous pouvez désormais afficher des graphiques à colonnes empilées à 100 %. Cette fonction est activée dans la boîte de dialogue Options du graphique.
[ Demo ][ Screenshot][Docs]
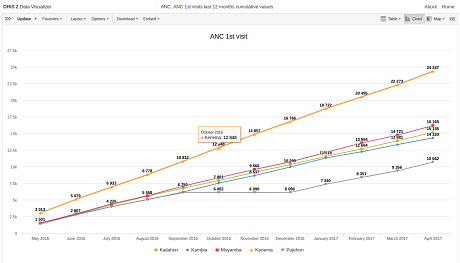
Valeurs cumulées dans les graphiques linéaires
Dans l’application Visualiseur de données, vous pouvez désormais créer des graphiques linéaires avec des valeurs cumulées. Cette fonction est activée dans la boîte de dialogue Options du graphique.
[ Demo 1 | 2 ][ Capture d’écran][Docs]
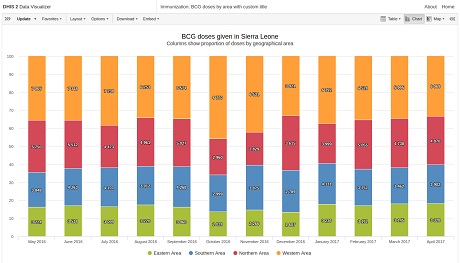
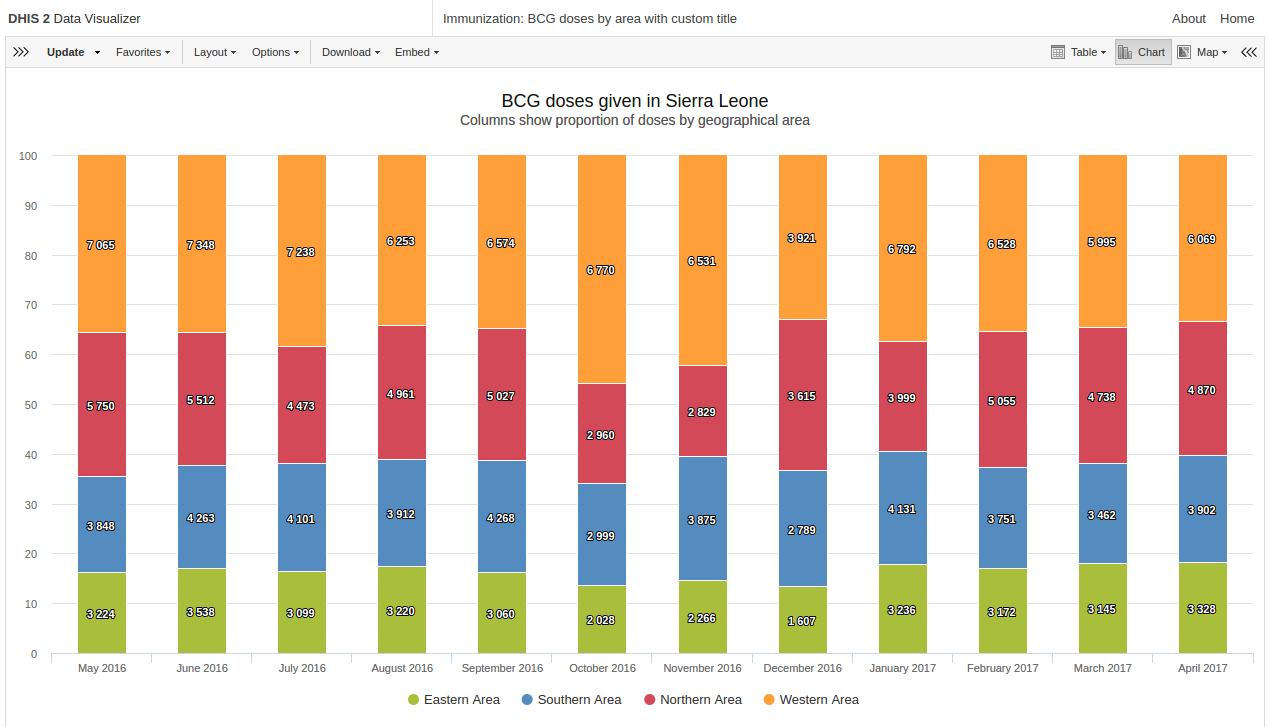
Gestion des titres de graphiques
Dans l’application Visualiseur de données, vous pouvez désormais contrôler le titre et le sous-titre du graphique, en termes de masquage ou d’affichage, ainsi que spécifier des titres personnalisés. Cette option est activée dans la boîte de dialogue Options du graphique.
[ Démo ][ Capture d’écran ][Docs]
Cacher la gestion des valeurs manquantes
L’application Visualiseur de données offre désormais un meilleur contrôle sur le masquage des valeurs manquantes. Vous pouvez choisir entre « Avant la première valeur », « Après la dernière valeur » et « Avant la première et après la dernière valeur ». Cette fonction est utile, par exemple, pour créer des diagrammes à colonnes et à barres. Cette option est activée dans la boîte de dialogue Options du graphique.
[ Démonstration] [ Capture d’écran ][Docs]
Semaines PEV
Le système prend désormais en charge différents types de périodes hebdomadaires, avec le lundi, le mercredi, le jeudi, le samedi et le dimanche comme premier jour de la semaine. Les données peuvent être collectées par le biais d’ensembles de données configurés pour utiliser le type de période hebdomadaire souhaité. Le moteur d’analyse attribuera les données hebdomadaires au mois qui contient quatre jours ou plus de la semaine.
[ Démo ][ Capture d’écran ][Docs]
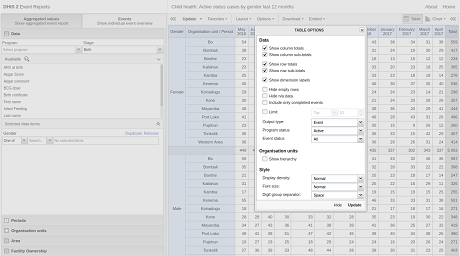
Flexibilité de l'ensemble du groupe
Les groupes d’éléments de données et les unités d’organisation peuvent désormais faire partie d’un nombre illimité d’ensembles de groupes. Cela permet une plus grande flexibilité dans l’analyse. Cette modification permet également de conserver la case à cocher « Tous les éléments » dans les favoris des applications d’analyse.
[ Démonstration] [ Capture d’écran ][Docs 1 | Docs 2]
Combinaisons d'options d'attributs dans les indicateurs
Vous pouvez désormais spécifier des éléments de données ainsi que des combinaisons d’options d’attributs dans les expressions d’indicateurs. Ceci est utile, par exemple, pour comparer les objectifs et les résultats, ou la performance de divers programmes dans les calculs d’indicateurs. La prise en charge de l’interface utilisateur n’est pas encore disponible, mais les combinaisons d’options d’attributs peuvent être saisies directement dans l’expression, voir la documentation.
[ Démo ][ Capture d’écran ][Docs]
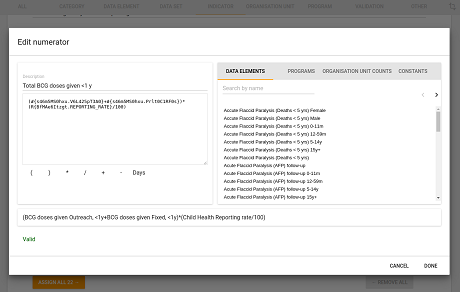
Taux de notification des indicateurs
L’indicateur permet désormais de spécifier des taux de rapport et des rapports réels dans des expressions. Ceci est utile, par exemple, pour ajuster l’exhaustivité des données dans les indicateurs de performance. La prise en charge de l’interface utilisateur n’est pas encore disponible, mais les taux de déclaration peuvent être saisis directement dans l’expression, voir la documentation.
[ Démo 1 | 2][ Capture d’écran ][Docs]
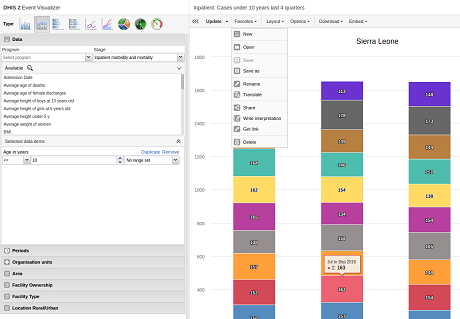
Favoris et interprétations dans les applications d'analyse d'événements
La nouvelle solution de favoris basée sur les fichiers a été introduite dans les applications Rapports d’événements et Visualiseur d’événements, similaire à la solution de l’application Tableau croisé dynamique, par exemple. Cela signifie que vous pouvez désormais créer et partager des interprétations pour les rapports d’événements et les graphiques d’événements.
[ Démonstration ][ Capture d’écran ][Docs 1 | Docs 2]
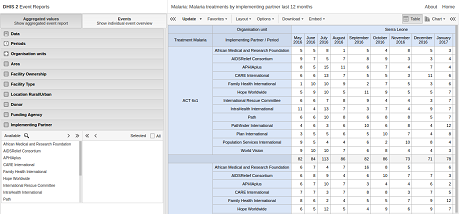
Dimensions des catégories de programmes dans les applications d'analyse d'événements
Les applications Rapports et Visualiseur d’événements vous permettent d’utiliser les catégories de programmes et les ensembles de groupes d’options de catégories comme dimensions pour les tableaux et les graphiques. Cette règle s’applique aux programmes comportant des combinaisons de catégories.
[ Démo 1 | 2 ][ Capture d’écran ][Docs 1 |2]
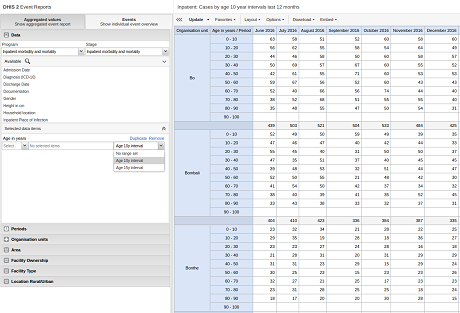
Plusieurs ensembles de données par élément de données
Dans les rapports sur les événements et les applications Visualiseur de données, vous pouvez agréger les événements en fonction de plusieurs ensembles de données par élément de données. Cela s’avère utile pour les groupes d’âge, par exemple. Vous pouvez collecter des données en années dans le cadre d’un événement, puis les agréger en différents groupes d’âge, par exemple par intervalles de 10 ans ou de 15 ans. De cette manière, les données peuvent être collectées une seule fois et utilisées ultérieurement pour répondre à de multiples besoins en matière de rapports.
[ Démonstration 1 | 2 ][ Capture d’écran 1 | 2 ][Docs]
État des programmes et des événements
Vous pouvez désormais filtrer les données par statut de programme et par statut d’événement dans les applications Rapports d’événements et Visualiseur d’événements. Vous pouvez définir ces filtres à partir de la boîte de dialogue des options.
[ Démonstration][ Capture d’écran ] [ Docs 1 | 2]
Nombre d'étapes du programme en indicateurs
Les indicateurs de programme comprennent une variable permettant de compter le nombre d’événements pour une étape du programme.
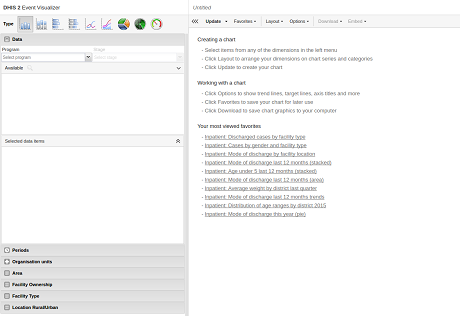
Les favoris les plus consultés
Les rapports d’événements et le visualiseur d’événements fournissent des liens vers vos favoris les plus populaires sur la page d’accueil.
[ Démonstration][ Capture d’écran ]
Caractéristiques générales
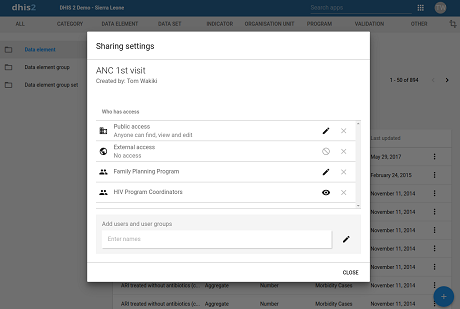
Dialogue de partage
Une nouvelle boîte de dialogue pour le partage des métadonnées est désormais disponible dans l’app Maintenance, offrant une expérience utilisateur améliorée et simplifiée.
[ Démo ][ Capture d’écran ][Docs]
Modes de notification
Les notifications de règles de validation peuvent désormais être envoyées sous forme de messages individuels ou de résumés de messages. Cette fonction est utile, par exemple, lorsque vous souhaitez envoyer des messages individuels en cas d’épidémies hautement prioritaires et des résumés en cas d’erreurs de validation des données de routine peu prioritaires.
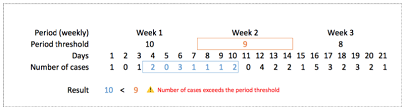
Fenêtres coulissantes dans les règles de validation
Les règles de validation peuvent désormais calculer les données sur la base de fenêtres temporelles glissantes. Cela implique que les données sont évaluées non seulement pour des périodes fixes, telles que des semaines, mais aussi pour des intervalles glissants de même durée, par exemple de mercredi à jeudi.
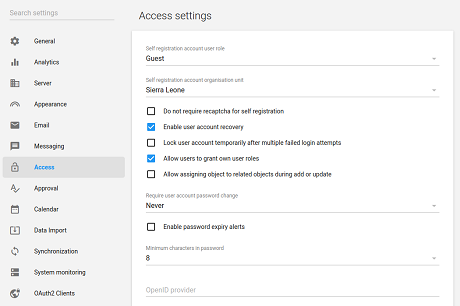
Amélioration de la sécurité des mots de passe
Le système offre désormais une plus grande sécurité et un meilleur contrôle des mots de passe. Pour l’activer, allez à System Settings (Paramètres du système) > Access (Accès).
- Des notifications par courrier électronique peuvent être envoyées aux utilisateurs 14 jours avant que leur mot de passe n’expire et ne doive être modifié.
- Le nombre minimum de caractères dans les mots de passe est configurable et peut être compris entre 8 et 14.
- Le mot de passe doit contenir une combinaison d’au moins trois caractères appartenant aux catégories suivantes : majuscules, minuscules, numériques et spéciaux (non alphanumériques).
- Lors du changement de mot de passe, les utilisateurs ne peuvent pas utiliser l’un des 24 mots de passe utilisés précédemment.
[ Capture d’écran ][Docs 1 | 2 ]
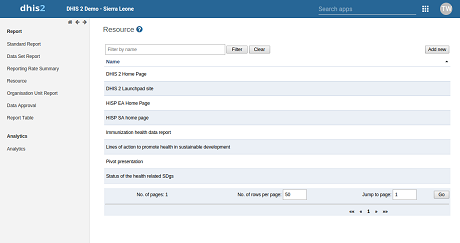
Stockage des ressources dans le nuage
Les ressources (fichiers et liens, que l’on trouve dans l’application Rapports > Resources) peuvent désormais être configurées et être sauvegardées par un fournisseur de stockage en nuage tel qu’AWS S3. Cela permet de stocker des fichiers à l’infini. Pour ce faire, vous devez configurer un magasin en nuage dans dhis.conf.
Remarque : si vous avez configuré le stockage en nuage dans le fichier dhis.conf, tous les fichiers que vous téléchargez ou que le système de fichiers génère utiliseront le stockage en nuage, et pas seulement les ressources.
[ Démonstration ][ Capture d’écran ][Docs 1 | 2]
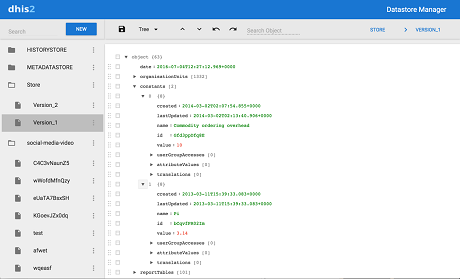
Gestionnaire du magasin de données
Une nouvelle application est disponible pour vous permettre de gérer le contenu des magasins de données de l’API Web. Cette fonction est utile pour gérer les applications et les scripts externes.
[ Démo ][ Capture d’écran ][Docs]
Caractéristiques du Tracker
Amélioration des règles du programme
Une toute nouvelle interface utilisateur pour la gestion des programmes a été introduite dans l’app Maintenance. La nouvelle interface utilisateur prend désormais en charge une série de nouvelles actions liées aux règles du programme :
- Attribuer une valeur. Permet d’effectuer des calculs côté client.
- Afficher le texte. Permet au client web d’afficher du texte dans les widgets d’indicateur ou de retour d’information.
- Afficher la paire clé/valeur. Permet au client web d’afficher une boîte d’information avec un titre et une valeur dans les widgets d’indicateur ou de retour d’information.
- Rendre le champ obligatoire. Permet aux règles du programme de rendre un champ obligatoire en fonction de l’expression de la règle.
Parmi les autres améliorations, citons la possibilité de supprimer et de modifier les variables des règles de programme (champs sources), et la possibilité d’inclure un élément de données dans plusieurs variables des règles de programme. Pour tous les messages d’avertissement et d’erreur, il sera désormais possible d’inclure une partie dynamique/calculée à la fin du message d’erreur statique.
[ Démonstration ][ Configuration de la capture d’écran | Expression de la règle | Action de la règle
| Capture du Tracker][Docs]
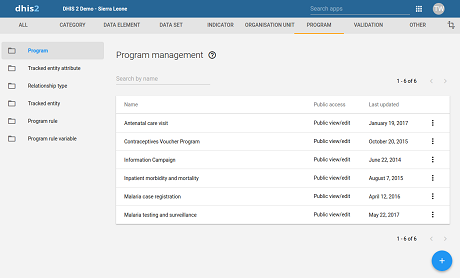
Programmes d'événements dans l'application Maintenance
L’app Maintenance prend désormais en charge la gestion des programmes d’événements. Il s’agit notamment d’une nouvelle interface utilisateur pour la création de programmes d’événements, l’affectation d’unités d’organisation, les sections, les formulaires personnalisés et les notifications. L’écran de création de programme est conçu comme un assistant qui permet de configurer le programme en plusieurs étapes. Les programmes de type Tracker se trouvent toujours dans l’ancienne application Programmes/Attributs.
[ Démo ][ Capture d’écran ][Docs]
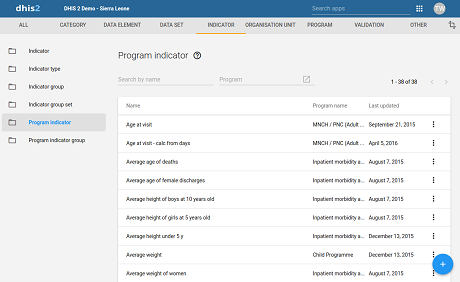
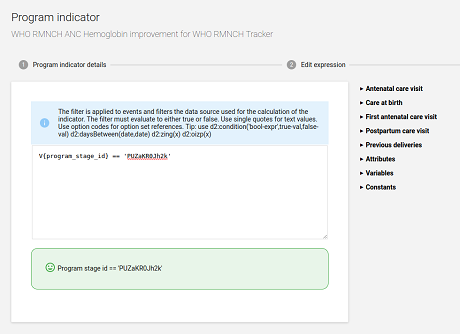
Indicateurs de programme dans l'application Maintenance
Les indicateurs de programme peuvent désormais être gérés dans l’app Maintenance. La nouvelle interface utilisateur vous permet de créer des indicateurs en trois étapes et simplifie la création d’expressions et de filtres.
[ Démo ][ Capture d’écran ][Docs]
Ordre de recherche des personnes
Dans l’application Saisie Tracker, vous pouvez désormais trier la liste des instances d’entités suivies en fonction de chaque colonne de la recherche.
[ Démonstration ][ Capture d’écran ]
Fonctions d'administration du serveur
Prise en charge de Memcached
Vous pouvez maintenant utiliser memcached comme fournisseur de cache d’application. Cela permet une plus grande évolutivité, car memcached peut être hébergé sur un serveur distinct hors de la pile.
[ Docs]
Caractéristiques de l'API WEB
Effacement progressif du Tracker
La suppression progressive a été introduite pour l’instance d’entité suivie et les entités d’inscription. Les clients disposant de bases de données locales ont ainsi la possibilité de réagir aux entités supprimées.
Journal des objets de métadonnées supprimés
La suppression des métadonnées est désormais enregistrée et peut être consultée à partir d’un nouveau point de terminaison /api/deletedObjects. Cela permet aux clients disposant de bases de données locales de réagir aux objets de métadonnées supprimés.
Envoi de courriels
Un nouveau point de terminaison pour l’envoi de courriels est introduit à /api/email.
Valeurs minimales et maximales des éléments de données
Un nouveau point d’accès pour la définition et la récupération des valeurs min-max des éléments de données est introduit à l’adresse /api/minMaxDataElements.
Exceptions au verrouillage
Un nouveau point d’accès permettant de créer, d’extraire et de supprimer les exceptions de verrouillage de l’ensemble des données est disponible à l’adresse /api/lockExceptions.
Schémas d'identification des exportations d'événements
La ressource d’exportation d’événements prend désormais en charge les schémas d’identification, c’est-à-dire qu’elle permet d’utiliser un code aussi bien qu’un identifiant.
Information sur la version
Cliquez sur les liens du tableau ci-dessous pour plus d’informations sur cette version du logiciel.
| To find more details about... | Follow this link: |
|---|---|
| Download release and sample database | Downloads |
| Documentation | Documentation |
| Upgrade notes | Upgrade |
| Source code on Github | DHIS2 source code |
| DHIS2 community | DHIS2 Community of Practice |