
 Video
VideoOutliers – Introduction to Outlier Analysis
Learn how outliers are calculated using sample data, including how mean and standard deviation are used to define thresholds and identify values that stand out.
Aller à une section de cette page
Outliers - Introduction to Outlier Analysis
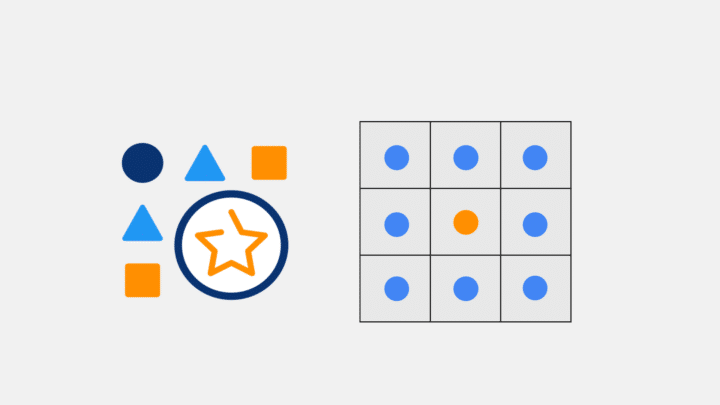
Review a detailed example of how an outlier is calculated using example data. In this example, we describe the calculation of outliers values use the mean and standard deviation to define thresholds for our outliers that subsequently allow us to identify outlier values. We also describe the different indicators that are calculated to provide insight into how outliers are effecting the your data, both by their relative weight as well as their number.
Outliers - Outlier Metrics
Learn how two outlier metrics can be reviewed once they are set up in DHIS: values that are outliers (%) and values excluding outliers (%). These two metrics should be reviewed together as they give us indications of 1) how many outliers we have in our dataset and 2) the impact our outliers are having on our final data values. Identifying the significance of outliers using these metrics is critical; without doing so it could easily lead to misinterpreting the performance of the outcomes and systems you are trying to evaluate and plan for.
Supporting resources
Link to the presentation slides.