Esta página ha sido traducida de manera automática y puede contener errores
Esta página ha sido traducida de manera automática y puede contener errores
El equipo de investigación Designing for Data Use, dirigido por HISP UiO e HISP WCA, identificó buenas prácticas de uso de datos, catalogó los retos y propuso soluciones que aprovechan las herramientas de análisis incorporadas en DHIS2 para lograr un impacto en los programas de TB, Malaria, EPI y otros programas de salud.
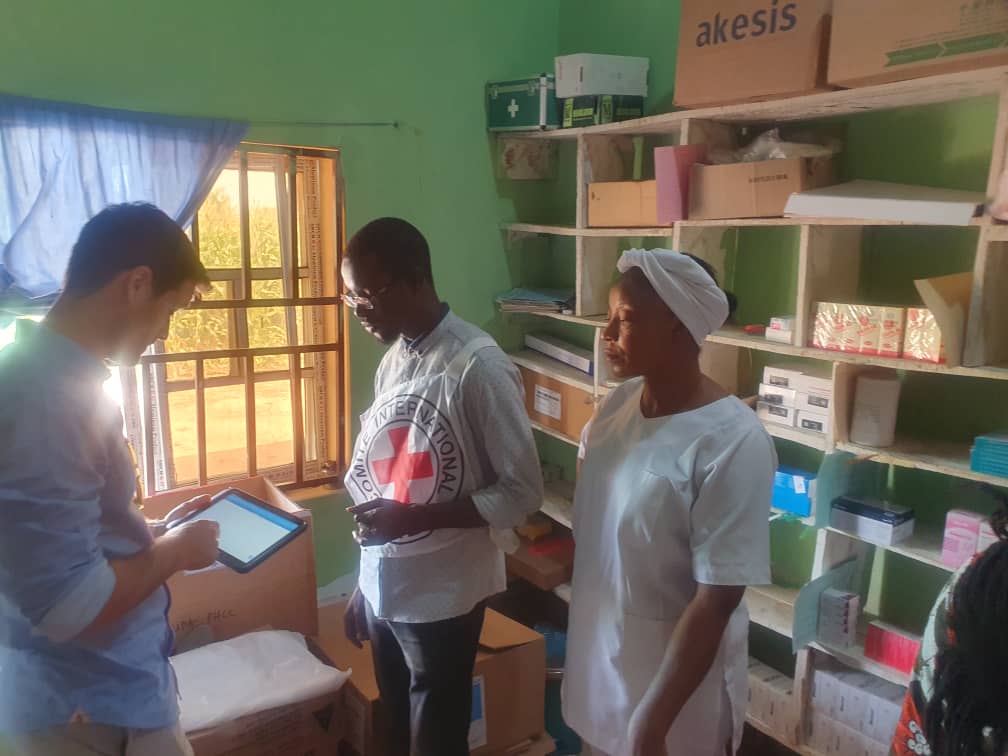
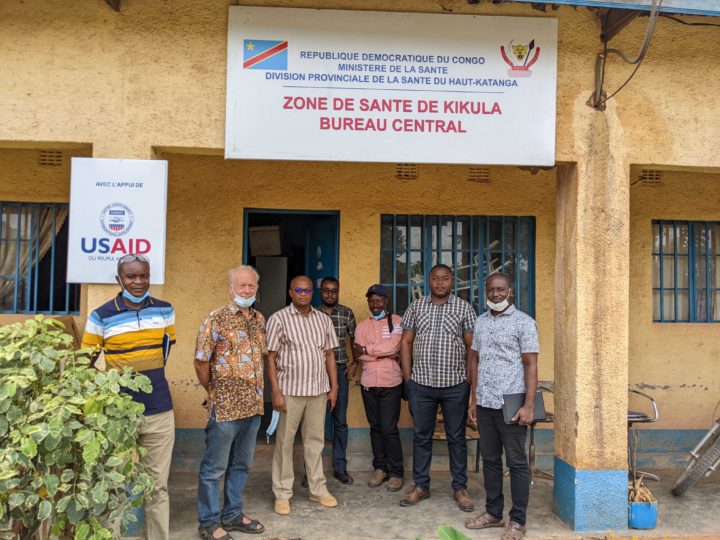
A lo largo de los últimos años, los investigadores de HISP en la UiO han llevado a cabo una investigación en acción con varios grupos de HISP y Ministerios de Sanidad para ayudar a identificar las barreras al uso de los datos, especialmente a nivel subnacional. Estas actividades de investigación pretenden facilitar intervenciones específicas para abordar los obstáculos detectados, incluido el diseño de productos informativos útiles, la resolución de los problemas de falta de datos y el desarrollo de capacidades en materia de análisis de datos. En el último trimestre de 2021, un equipo dirigido por el profesor Jørn Braa e HISP África Occidental y Central (WCA) llevó a cabo una evaluación de la implantación de DHIS2 como Sistema de Información de Gestión Sanitaria (HMIS) en la República Democrática del Congo (RDC). El equipo visitó 5 zonas sanitarias, centros de salud y varias partes interesadas en el HMIS en las provincias de Kinshasa y Haute Katanga para estudiar y evaluar el HMIS de la RDC, centrándose en el uso de los datos a todos los niveles.
DHIS2 se implementó en la RDC como un HMIS a escala nacional en 2013 y se ha utilizado para la planificación y gestión de programas de salud a nivel zonal, provincial y nacional. Esto ha sido posible gracias a los esfuerzos del gobierno de la RDC, el HISP y socios como Gavi, el Fondo Mundial (FM), USAID, los CDC y MEASURE Evaluation (ME), entre otros, cuyo apoyo a programas sanitarios específicos como la malaria, el VIH, la tuberculosis y el Programa Ampliado de Inmunización (PAI) han contribuido a reforzar el HMIS de la RDC en su conjunto.
Al evaluar en qué medida se utilizan los datos sanitarios para respaldar la toma de decisiones basada en pruebas en la RDC, el equipo de investigación de HISP descubrió que, aunque las herramientas digitales como DHIS2 estaban infrautilizadas, tanto la introducción como el uso de datos se realizaban de forma rutinaria en la RDC. Vacunación, tuberculosis, malaria y otros programas sanitarios. Este uso eficaz de los datos sanitarios tiene lugar a pesar de varios retos a los que se enfrenta la división HMIS del Ministerio de Sanidad, como la fluctuación de la financiación, la fragmentación organizativa y los problemas de infraestructura. El equipo de HISP trabajó con las partes interesadas locales para desarrollar herramientas de análisis de datos dentro de DHIS2 con el fin de mejorar las prácticas actuales de uso de datos de la RDC mediante la mejora de la calidad de los datos y el aumento de la eficiencia en la presentación de informes.
La RDC es un gran país con una población de unos 90 millones de habitantes. La vasta superficie del país está dividida en 519 zonas sanitarias repartidas por 26 provincias. Los datos rutinarios sobre los indicadores clave de las zonas sanitarias se recogen en los centros sanitarios de cada zona. Los trabajadores sanitarios de la comunidad de la zona de captación de un centro recopilan datos en formularios impresos que se envían al centro, donde se cotejan con los demás informes impresos del centro. Al final de un periodo de notificación, los centros envían sus datos en papel a la oficina de coordinación de la zona de salud como parte de un informe más elaborado que incluye datos sobre los resultados del programa, la gestión de existencias y la vigilancia de enfermedades. Posteriormente, los informes se introducen en el Système National d’Information Sanitaire (SNIS), la plataforma nacional DHIS2 de la RDC para la gestión de la información sanitaria, en las zonas de salud.
Aunque la introducción descentralizada de datos en DHIS2 está disponible en algunos grandes centros sanitarios con suministro eléctrico fiable y conexión a Internet, la mayor parte de la introducción de datos se realiza de forma centralizada en las zonas de salud. El equipo observó que en los centros visitados cuentan con personal suficiente para realizar la introducción de datos en todos los establecimientos sanitarios, excepto en Kikula, donde sólo un miembro del personal es el principal responsable de la tarea. La falta de herramientas, como ordenadores conectados a Internet y electricidad, sigue dificultando la introducción de datos en las instalaciones. Hasta el reciente cierre de su proyecto en Kikula y Kapolowe, ME había financiado el suministro de ordenadores portátiles y cuotas mensuales de Internet en 63 centros sanitarios para la introducción de datos en los centros. La experiencia fue un éxito durante unos 2 años, antes de que cesara la financiación y los dispositivos se deterioraran, sin sustitución ni mantenimiento. Esto ha demostrado que, con una financiación adecuada, puede lograrse fácilmente la introducción descentralizada de datos en los centros, mejorando así la calidad de los datos del SNIS.
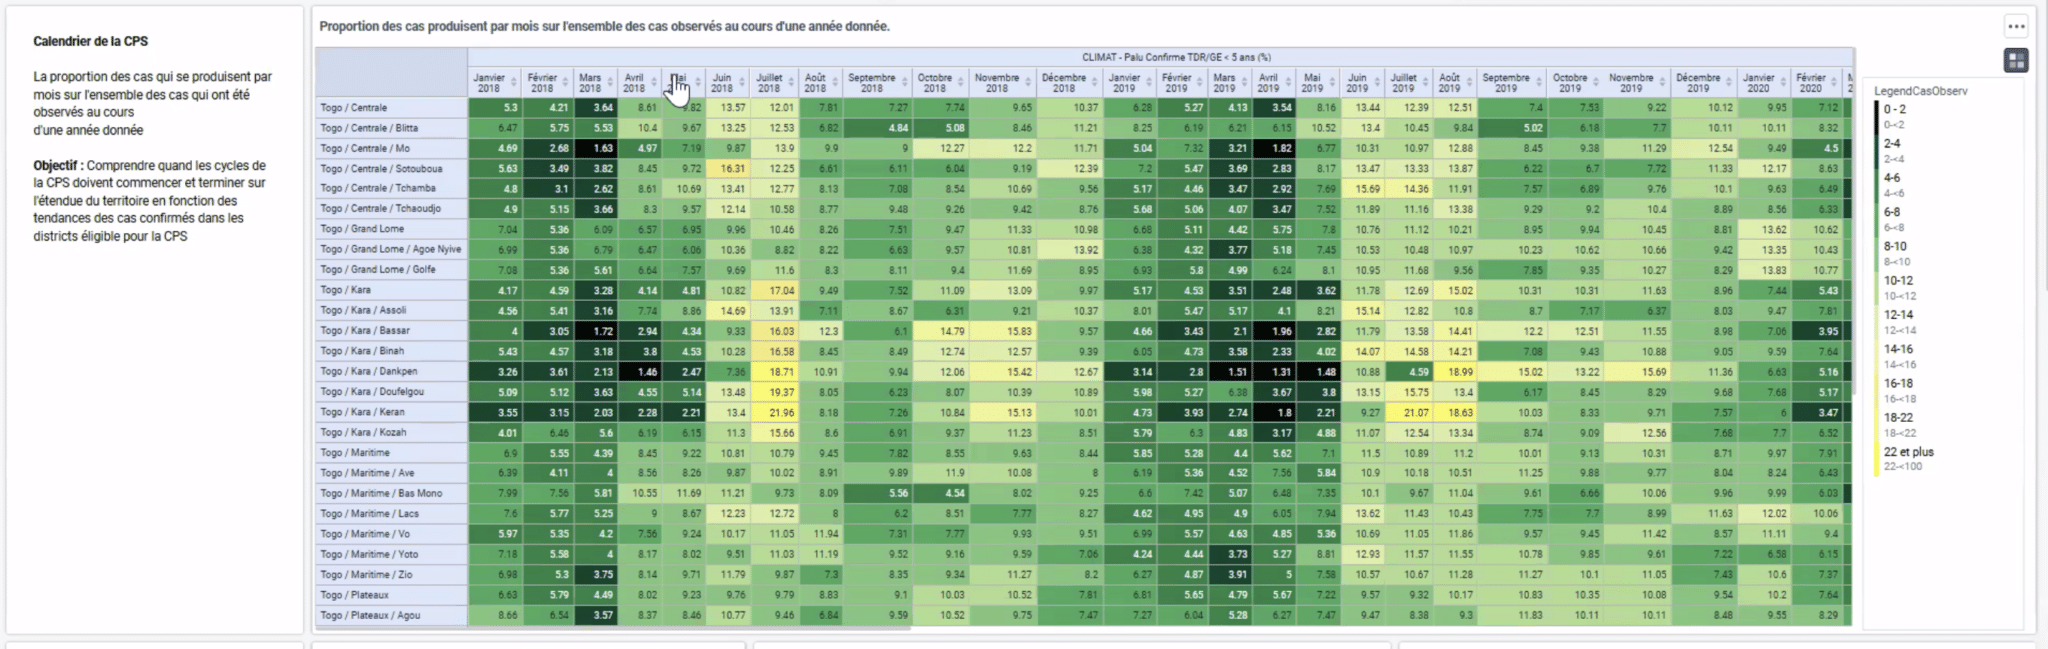
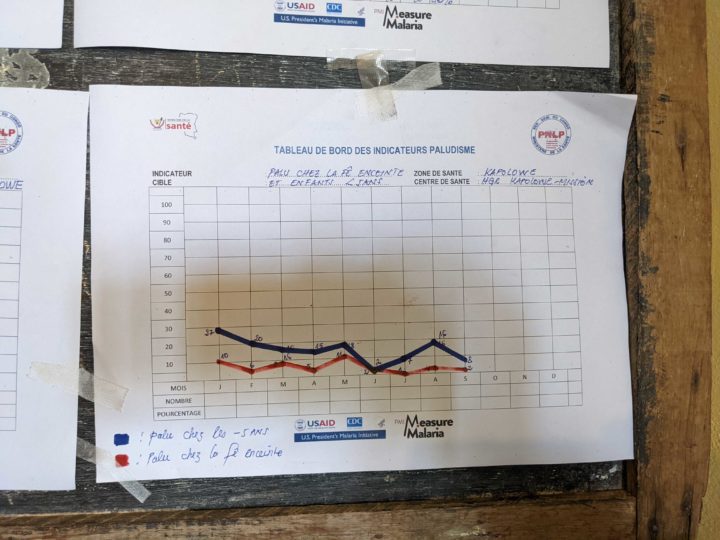
Un ejemplo de captura y uso de datos es el Programa Nacional de Control de la Tuberculosis (PNLT), que se basa en los datos enrutados recogidos en los centros de diagnóstico y tratamiento de la salud (CSDT) e introducidos en DHIS2 a nivel de zona de salud para supervisar el rendimiento del programa. En octubre de 2021, los datos sobre infección por TB, coinfección por VIH/TB y tratamiento de 2061 CSDT se recopilaron de forma rutinaria en formularios de notificación en papel estandarizados -con una tasa de integridad del 92,8% en 2020-, se validaron en los centros y luego se enviaron a las Zonas de Salud para su entrada en DHIS2. Los datos de DHIS2 se exportan a MS Excel, donde los gestores de las zonas de salud los utilizan para realizar análisis rutinarios y tomar decisiones. La situación es similar en programas como el PAI y la malaria, que utilizan los datos del DHIS2 para elaborar informes mensuales que incluyen evaluaciones de la exhaustividad y la puntualidad, la revisión de indicadores clave como la prestación de servicios y la detección de casos concretos, y recomendaciones concretas para la acción. A nivel provincial y nacional, esto proporciona a los gestores de programas una visión más amplia, por ejemplo, permitiendo al programa de malaria identificar provincias con diferencias superiores al 10% entre los casos de malaria identificados y los casos tratados, así como hacer un seguimiento de la falta de existencias de suministros para la malaria y planificar acciones de seguimiento específicas.
Uno de los problemas que el equipo observó en la recopilación de datos fue que algunas de las herramientas de introducción de datos en papel utilizadas sobre el terreno estaban obsoletas en comparación con las versiones actuales del SNIS, incluidos los formularios de vigilancia y la sección de gestión de existencias de los conjuntos de datos del PAI. Esto obliga a los TCS y a otros usuarios a dibujar a mano columnas adicionales en los formularios para que se recojan todos los datos necesarios. A la vista de las limitaciones a las que se enfrenta la introducción de datos en los distintos niveles, cabe señalar que la tasa de cumplimentación de datos en el SNIS supera habitualmente el 80% de referencia para las áreas de captación, las zonas de salud y las provincias. Esto es un testimonio de la buena formación y el compromiso del equipo del HMIS, y del apoyo de los donantes y los socios técnicos en la movilización de recursos y formación para apoyar estos esfuerzos.
Aunque la introducción periódica de datos precisos en DHIS2 es un logro, el valor de esos datos reside en la capacidad de los gestores de programas y otras partes interesadas para utilizarlos con el fin de evaluar el rendimiento y tomar decisiones. En la RDC, el equipo de investigación del HISP encontró buenas prácticas a varios niveles para revisar y validar los datos y utilizarlos para impulsar acciones específicas:
Los miembros del equipo HMIS de la RDC están entusiasmados con el uso de los datos en los distintos niveles visitados por el equipo de investigación. Sin embargo, como señaló el equipo de investigación de HISP, hay problemas con la introducción y validación de los datos que han repercutido negativamente en su calidad y limitado la capacidad de utilizarlos. Por ejemplo, los errores derivados de la recogida de datos en papel o de la introducción manual en DHIS2 han dado lugar a resultados inexactos capaces de orientar erróneamente la dirección de las intervenciones políticas. Un ejemplo de errores derivados de una validación defectuosa en los niveles inferiores fue un informe de 17.000 nuevos casos de tuberculosis registrados en un centro en un solo mes. Este error sólo se detectó a nivel nacional, ya que pasó desapercibido en los centros, las zonas de salud y las provincias. Las herramientas de calidad de datos de DHIS2, como las reglas de validación que pueden ayudar a validar y corregir estos valores erróneos, ya existen en el sistema DRC, pero es necesario reforzar las rutinas en torno a su uso.
La calidad de los datos de los análisis manuales, a los que recurrieron los usuarios como consecuencia de los problemas de infraestructura, se vio aún más degradada por la falta de datos de población en los centros sanitarios. La mayoría de los centros visitados no disponían de datos sobre la población destinataria. Algunas otras instalaciones tienen sus propios objetivos de población para la cobertura de antígenos que fueron desarrollados por el Programa EPI. En conjunto, estas dificultades frustran a los usuarios del SNIS y limitan considerablemente el potencial del DHIS2 en la RDC.
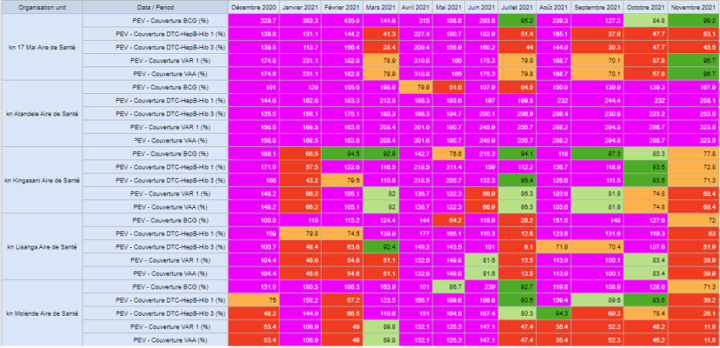
Utilizando estos objetivos de población, cuando estaban disponibles, y una proporción calculada de la población de captación de otros centros como denominadores, el equipo de investigación de HISP desarrolló prototipos de herramientas en Excel que simplificaban el análisis de datos fuera de línea en los centros y zonas de salud, impulsando así los esfuerzos de utilización de datos y mejorando la calidad de los mismos. Algunas de estas herramientas incluyen cuadros de mando para la cobertura de servicios en los centros y distritos. Posteriormente, el equipo creó paneles en DHIS2 que mostraban el rendimiento de los centros durante un periodo de 12 meses mediante el cálculo de indicadores como las tasas de abandono y la cobertura de los servicios, entre otros. Estos cuadros de mando dinámicos eliminaron la necesidad de que los usuarios continuaran con el método manual de descargar los datos de DHIS2 y calcular los indicadores con MS Excel, ya que las visualizaciones se actualizan automáticamente cuando se introducen los datos de un nuevo mes en el sistema DHIS2. Esto facilita la vida a los usuarios locales y mejora la calidad de los datos, ya que los errores de validación que antes daban lugar a datos de mala calidad también pueden identificarse y resolverse localmente mediante las herramientas integradas de DHIS2. El equipo de investigación espera que estos prototipos puedan adaptarse a otras zonas del país.
Además, el equipo de investigación observó que algunas de las herramientas en papel para la recogida de datos, así como las guías para sus análisis, estaban obsoletas. Algunos ejemplos son los anexos de los Documents Normatifs relativos a la gestión y el funcionamiento de los HMIS, entre otros. En consecuencia, el equipo sugiere que las directrices de gobernanza y procedimiento, los PNT y los formularios de recogida de datos se actualicen para reflejar las directrices prácticas actuales. En su caso, los formularios en papel podrían sustituirse por herramientas digitales para facilitar el cumplimiento de las normas de calidad de los datos.
El equipo de investigación de HISP identificó varios retos pendientes que restringen el uso de estas herramientas DHIS2 en la RDC. La escasez de infraestructuras hace que la introducción de datos esté centralizada en gran medida, y los trabajadores de los centros y las zonas suelen carecer de los conocimientos necesarios para analizar los datos y obtener información a partir de los datos disponibles. Además, la estructura de gobierno del país, con diferentes ministerios que trabajan en silos, dificulta la coordinación.
Para resolver estos problemas, es necesaria una clara delimitación de funciones y responsabilidades entre los departamentos y organismos. La celebración periódica de reuniones de coordinación de las partes interesadas para supervisar el plan de refuerzo del SIGS, gestionar las necesidades y coordinar las iniciativas del SIH y la movilización de recursos también fomentaría la colaboración y minimizaría los conflictos. Por último, la calidad y el uso de los datos, especialmente en los niveles de gobierno más bajos, como las instalaciones y las zonas, mejorarían con la descentralización de la recopilación de datos y el desarrollo de la capacidad de análisis de datos, así como con la mejora de las infraestructuras.
A pesar de las numerosas dificultades, el sistema nacional de gestión de la salud de la RDC, basado en DHIS2, es en gran medida un éxito. El sistema ha sido útil en la gestión de muchos programas sanitarios, como los de tuberculosis, malaria y PAI, al facilitar la recopilación de datos completos y oportunos y la toma de decisiones basada en datos. Con el apoyo sostenido del gobierno de la RDC, junto con la financiación y los socios ejecutores, el uso de datos sanitarios en todos los niveles del programa ha mejorado a lo largo de los años. Mientras que la infraestructura limitada, la falta de habilidades clave en el análisis de datos y los cuellos de botella administrativos limitan la plena utilización de los sistemas, las recomendaciones formuladas por el equipo de Diseño y Uso de Datos de HISP UiO y HISP WCA mejorarían la eficiencia, impulsarían la calidad de los datos y crearían capacidad para un mayor uso descentralizado de los datos de HIS en la RDC.