Go to the main page

DHIS 2.24 Overview

Explore DHIS2 version 2.24, which includes many new features, apps, improvements, and bug fixes. On this page you can find information on this software version, including feature descriptions, links to technical documentation, and more

Jump to a section on this page

    Analytics Features

    GIS layers for elevation, population density and nighttime lights

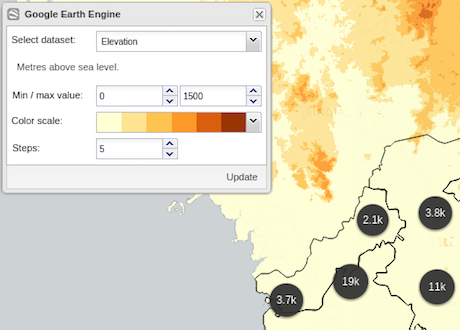
    DHIS 2 now supports map layers from Google Earth Engine, which includes more than thirty years of historical imagery and scientific datasets, updated and expanded daily. So far we support three datasets, but more layers will be added in the months to come. You can find the Earth Engine layers in the top menu, next to the boundary layers. The elevation layer can be used to visualise the risk of mosquito-borne diseases. Select a color scale, minimum and maximum elevation, and the number of steps to divide your range in. The same options are available for the population and nighttime-lights layers, another indicator of where people live.

    [ Screenshot 1 | 2 | 3 | 4 ] [ Demo 1 | 2 | 3 ] [Documentation]
    Place search in GIS

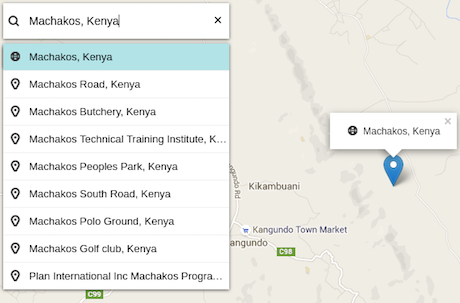
    You can now search for places and regions on the GIS app. Click on the magnifier icon and type the name of the place. You will get suggestions as you type. Select a place in the list to see it marked on the map. Click the x-button in the search field to remove the marking.

    [ Screenshot ] [ Demo ] [Documentation]

    Color scales for GIS thematic layers

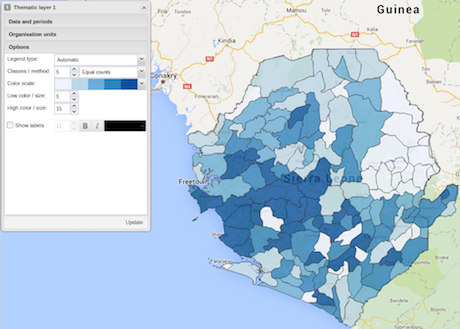
    Select among nice looking color scales from ColorBrewer when you visualise thematic layers. These scales create more accurate and user friendly maps, as the distances between colors are proportional to their perceived difference.

    Screenshot ]

    Reporting rates on time

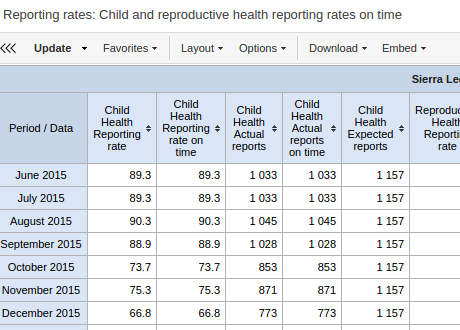
    The pivot table apps lets you view reporting rates based on timely form submissions. A timely submission must happen within a number of days after the reporting period. This number is configurable per data set. In the pivot table or data app, select Data > Data sets > Reporting rates on time or Actual reports on time and then select your data set.

    Screenshot ] [ Demo ] [ Documentation ]

    Reporting rates by data set categories

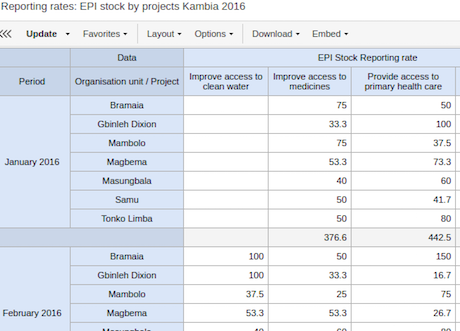
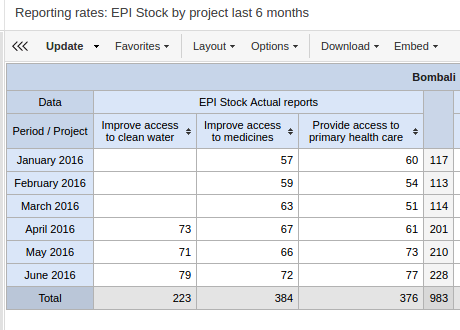
    Analytics now supports reporting rates broken down by data set categories. As an example, if your data set collects data for multiple projects modeled as data set categories, you can view the reporting rate for individual projects. Try it out on the demo by selecting the EPI Stock data set and the Project category.

    Screenshot ] [ Demo ]

    Expected reports based on org unit opening and closed date

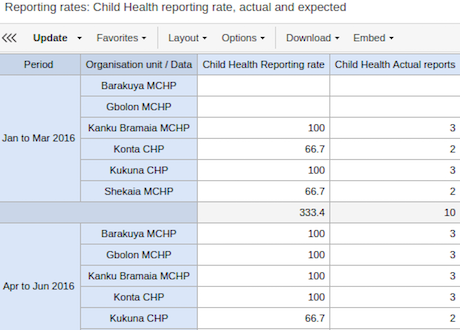
    For reporting rates in analytics, the number of expected reports is now calculated based on whether the organisation units assigned to the data set were open or not for the aggregation period. As an example, if you ask for reporting rates for a district for June, and one of the facilities within the district was not open until August, that facility will not be included in the number of expected reports.

    Screenshot ]

    Expected reports based on category option start and end dates

    For reporting rates which involve data set categories, the number of expected reports is now calculated based on start and end dates of the relevant category options. In other words, complete registrations for category options are only included if the aggregation period is within their start and end dates.
    Screenshot ] [ Demo ]

    Pivot table filter title

    The pivot table app now displays the items currently selected as filters as a title on top of the table.

    Screenshot ] [ Demo ]

    General Features

    Improved maintenance app

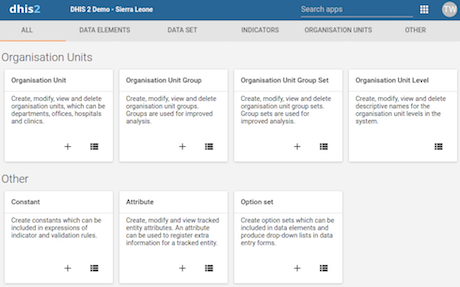
    Data sets, metadata attributes, constants and option sets are now supported in the Maintenance app.

    Screenshot ] [ Demo ] [ Documentation ]

    Apps and object search from menu

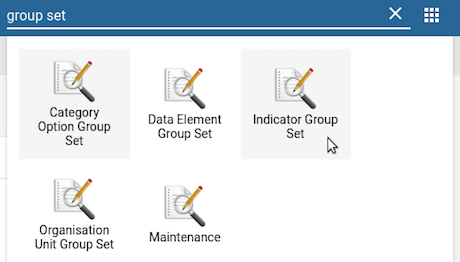
    You can now navigate directly to an object type from the App menu. For example, search for “group set” in the top menu, and navigate directly to the list of organisation unit group sets or indicator group sets, without navigating first to the maintenance app.

    Screenshot ]

    Improved data usage statistics

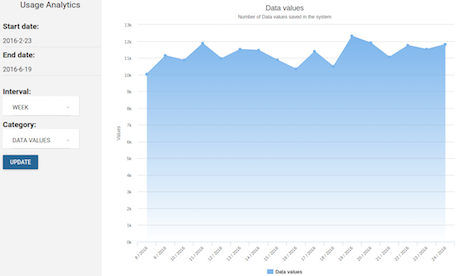
    The Usage Analytics app now provides reports for the most viewed favorites by type (or example pivot table and chart) and number of data values stored per day.

    Screenshot 1 | 2 ] [ Demo ] [ Documentation ]

    Ticket system

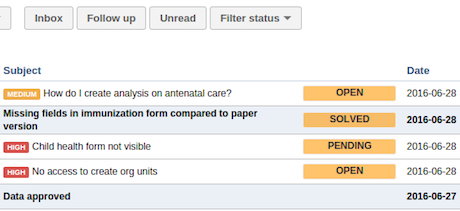
    You can now set priority and status for feedback messages. This allows you to use the DHIS 2 messaging as a basic ticket system useful for managing user support. Each message can be treated as a ticket and go through a workflow (similar to e.g. Zendesk). You can also send internal messages, visible only to other ticket administrators. This requires membership to the “Feedback recipient” user group.

    Metadata synchronization

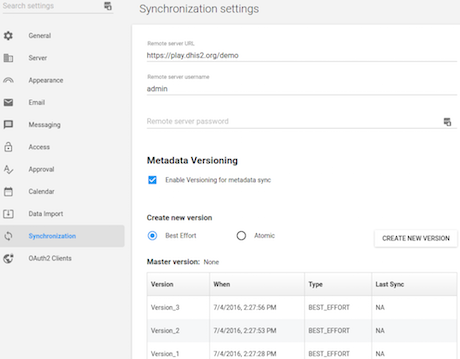
    Metadata synchronization enables DHIS 2 instances to synchronize metadata with each other. Given a central and multiple remote instances, metadata created at central can sync with the remote instances. The remote instances will check the central instance for new, available metadata packages/versions. This allows the implementor to roll out metadata updates in a controlled and staged manner.

    [ Screenshot ] [ Documentation 1 | 2 ]

    Tracker Features

    Tabular data entry widget

    Tracker capture has a new data entry widget that allows for tabular-style data entry. It displays the list of program stages as left-hand side labels. Events will be listed in table for repeatable program stage, and allows for in-line edits of event data values. The widget can be enabled from the tracker dashboard by going to gear icon > Show/hide icons and selecting “Tabular data entry”.

    [ Screenshot ] [ Demo ] [ Documentation ]

    Open tracker dashboard from URL

    Tracker dashboards can now be opened directly from URLs. This is useful e.g. in order for integration with other tracker apps. Security rules are still applied.

    [ Demo ] [ Documentation ]

    Improved program rules

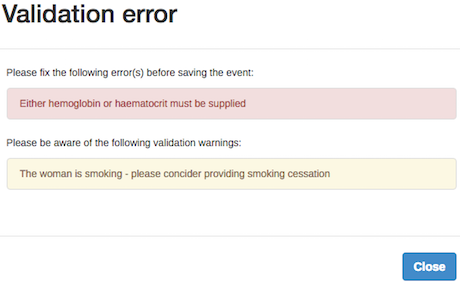
    There are two new types of actions for program rules. These allow consolidated errors and warnings when events is completed (in tracker capture) and saved/updated (in event capture). This is useful when there is a combination of things in the form that should trigger an error/warning, whereas each single data element might be legal in itself. One such example is conditional mandatory fields. Check out the Antenatal care visit program on the demo.

    [ Screenshot 1 | 2 ] [ Demo ] [ Documentation ]

    System-generated identifiers

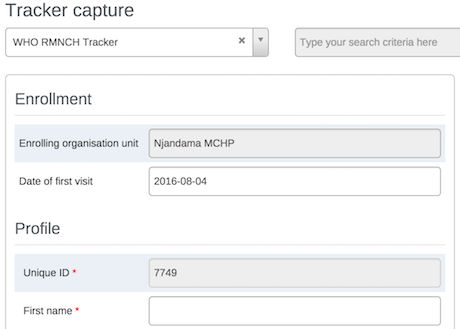
    For unique tracked entity attributes you can now have the system automatically generate and assign numeric IDs. When registering tracked entity instances on web, the tracker capture registration form will automatically be populated with a number in the given pattern. In tracker on Android, the ID generation is used to reserve a series of IDs for each Android device. This allows offline registration of tracked entity instances without risking duplicate IDs when syncing with the server. Have a look at the WHO RMNCH Tracker program on the demo.

    Demo ] [ Documentation ]

    WEB API Features

    Improved translations solution

    The database translations solution has been completely rewritten and nows works while “traversing the object graph”. This means that you can navigate e.g. JSON documents from dataElement to groups and still get translated a displayName. This will also fix a range of issues where un-translated content appeared in the user interface of apps.

    [ Documentation ]

    Data predictors

    A new solution for generating predicted values have been introduced in the Web API. This component will be useful for generating thresholds for disease surveillance, population growth and more. We will provide a UI for this and more info in version 2.25.

    Documentation ]

    Program messages

    The Web API now features a new concept for program messages, which allows you to send messages to tracked entity instances, emails and SMS. This can be useful e.g. in order to send reminders about upcoming visits and notifications for awareness programs to people.

    Docs ]

    Release Information

    Click on the links in the table below for more information about this software release.

    To find more details about...Follow this link:
    Download release and sample databaseDownloads
    DocumentationDocumentation
    Upgrade notesUpgrade
    DHIS2 communityDHIS2 Community of Practice