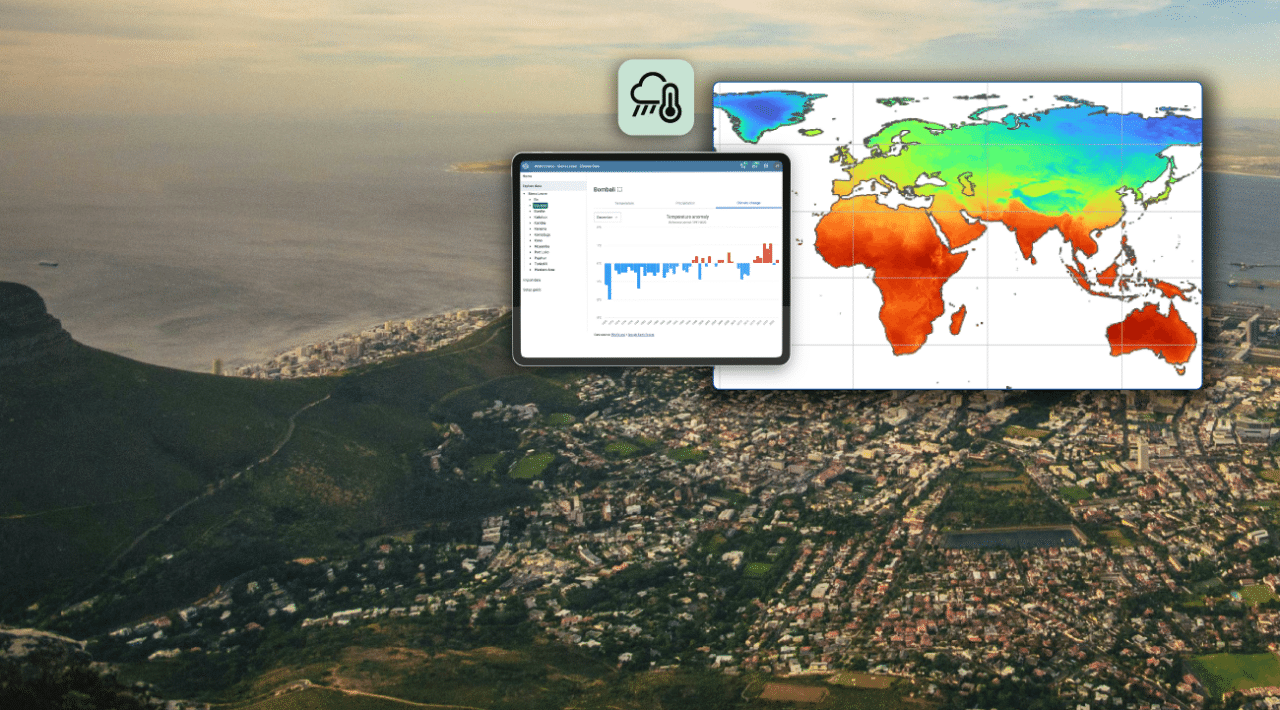
The app allows DHIS2 users to explore daily and monthly temperature, precipitation, and humidity data–and more–for your organization units, and to import it as DHIS2 data elements. These data sets are automatically harmonized with health data in DHIS2, allowing them to be analyzed and visualized together through a variety of charts, graphs, and maps. They can also be used for predictive modeling through the DHIS2 Modeling App and Chap Modeling Platform.
The app draws on a curated selection of high-quality data sources, including ERA-5 land, which is considered to be the most accurate and complete climate dataset available with worldwide coverage, the CHIRPS rainfall dataset, and satellite-based datasets from the Climate Hazards Center. Current datasets available in the Climate App include:
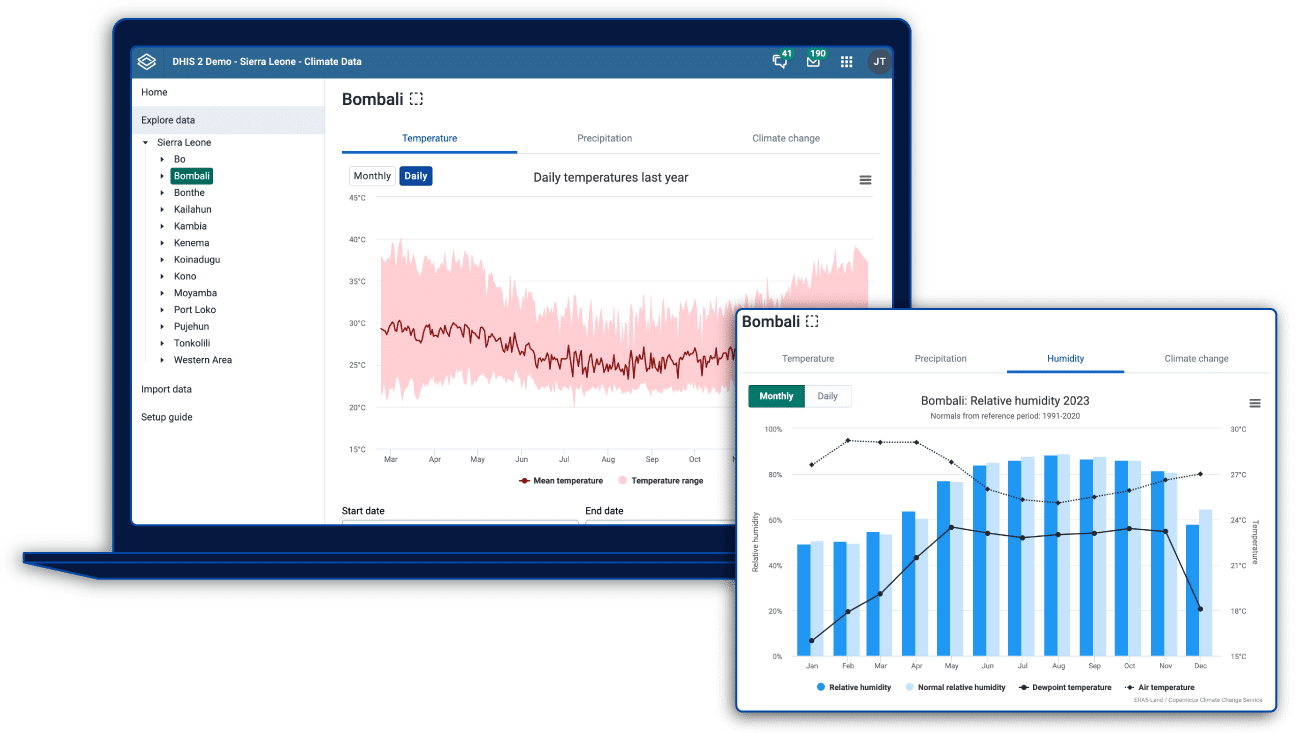
- Average temperature and the temperature range (monthly and daily).
- Precipitation (monthly and daily). Monthly values can be compared with averages from a 30-year reference period (1991-2020 and 1961-1990).
- Humidity (monthly and daily), showing relative humidity combined with air temperature and dewpoint temperature.
- Temperature anomaly, which shows how the monthly average temperature has changed since 1970.
- Heat and cold stress based on the Universal Thermal Climate Index (UTCI), which combines the effects of air temperature, humidity, wind speed, and radiation on the human body.
- 10-day weather forecast for any health facility (with coordinates defined).
- Vegetation (16-day intervals) using the Normalized Difference Vegetation Index (NDVI), which is used to measure and monitor plant growth and vegetation cover.
- Land cover (yearly) provides data for 17 different categories (e.g. cropland, wetlands, urban and built-up).
- Elevation data on the mean, lowest and highest elevation for your organisation units.
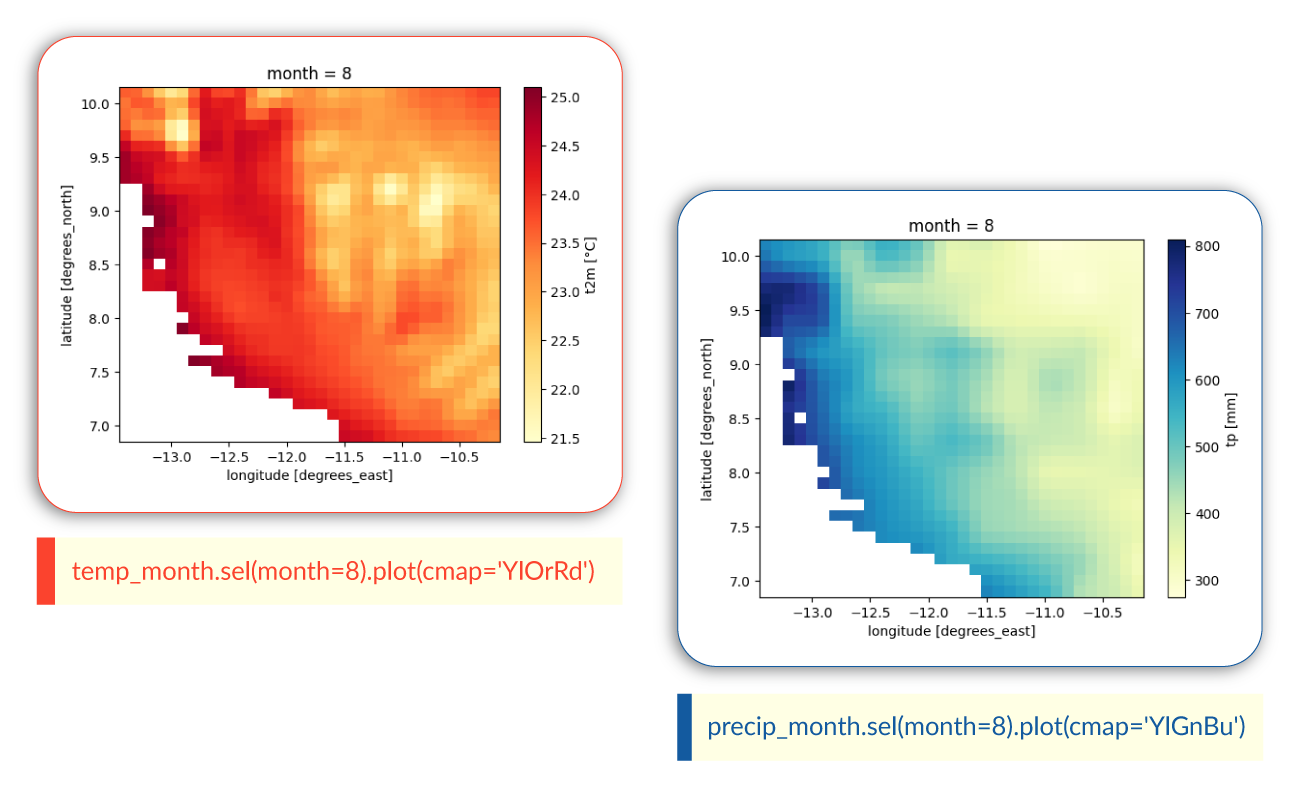
The data is calculated for DHIS2 organisation units by using Google Earth Engine. DHIS2 instances must have the Google Earth Engine enabled in order to use the Climate App. DHIS2 Climate Tools provide a fully open-source alternative, and we are currently working on open-source alternatives for data harmonization within the Climate App itself.
Learn more & Download