The DHIS2 Annual Conference takes place from 15-18 June 2026! Learn more

The DHIS2 Annual Conference takes place from 15-18 June 2026! Learn more
The Scorecard App, developed by HISP Tanzania, has made it easier for Tanzania’s Ministry of Health to monitor key indicators, improve reporting rates, and plan targeted interventions
Tanzania has more than a decade of experience using DHIS2 to collect and analyze health data at the national scale through its Health Management Information System (HMIS). While some of the benefits of digitalizing their HMIS were immediate–such as faster reporting and improved access to data, there were clear challenges around the use of data to guide decisions. In particular, many health workers lacked capacity in using analytics tools and visualisations to transform the data they had access to into meaningful analyses.
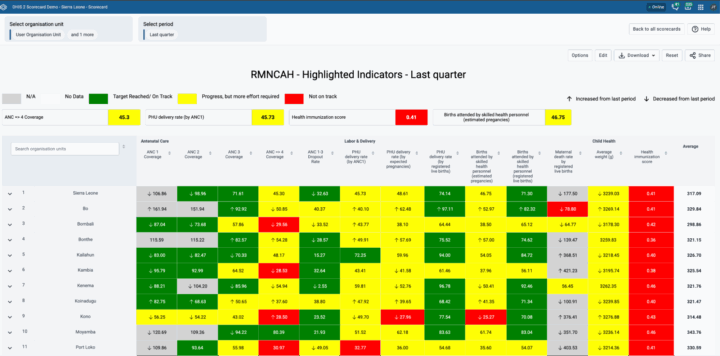
To address this, HISP Tanzania worked with the Ministry of Health (MoH), UNICEF, and HISP Uganda to design the DHIS2 Scorecard App, which uses a simple color-coded “traffic light” framework to quickly show stakeholders which key indicators are performing well, in progress, or need attention, from the national level all the way down to individual health facilities.
By using scorecards in DHIS2, Tanzanian health programmes like Reproductive and Child Health (RCH) and the National Tuberculosis and Leprosy Programme (NTLP) have been able to drive improvements to the speed and completeness of data reporting, improve data quality, and make progress towards key health goals, such as reducing maternal mortality and increasing adherence to TB-HIV testing and treatment policies.
In the public health context, a scorecard is a visualization tool for monitoring key indicators. It uses a traffic light analogy, where green means the target has been achieved, yellow means there is some progress, and red means there is a problem that needs to be addressed. By focusing only on the most significant indicators and using this visual treatment to call attention to problem areas, a scorecard makes it easier to monitor progress and identify issues, without requiring expertise in public health or data analysis. This makes scorecards an effective tool for communicating performance to decision makers so that they can see where the gaps are and allocate resources to address them.
The Scorecard App is a custom application for DHIS2. It can be freely downloaded and installed in any DHIS2 system from the DHIS2 App hub, and easily configured for specific programmatic needs and local contexts, and then used on a routine basis to inform decision making.
Key features of the Scorecard App include:
The DHIS2 Scorecard App is part of a suite of tools developed by HISP Tanzania in partnership with UNICEF, HISP UiO, and HISP Uganda with the aim of supporting effective data use. These include the Scorecard App, the Bottleneck Analysis (BNA) App, and two Action Tracker Apps, one that is linked to the BNA App and one that functions as a standalone tool to help track activities and interventions.
These apps are designed to be used together: The Scorecard App helps you quickly spot where the problem areas are. The BNA App then helps determine the root causes of these underperforming indicators on the scorecard, helping you understand what to do to address them. The Action Tracker then helps track specific actions that you decide to implement to improve indicator performance, supporting follow through.
HISP Tanzania has also developed a comprehensive user guide to help countries and organizations implement and use these apps to support data use.
DHIS2 has been used as Tanzania’s national HMIS since 2013, replacing the DHIS v1 system that had been in use since 2007, which in turn had replaced a paper-based system. The goal of digitalizing Tanzania’s HMIS was to improve the speed and quality of routine health data collection and support data-driven decision making.
However, while these systems did simplify and improve data collection, the level of data use in Tanzania’s MoH remained relatively low. One significant barrier was that while DHIS2 provides many built-in options for visualizing data, many workers in the MoH did not have experience analyzing data through visualizations like charts or graphs. To overcome this barrier, a simpler means of representing key indicators was required.
The scorecard project began in 2011 with the African Leaders Malaria Alliance (ALMA), which was focused on reducing malaria and wanted a simple mechanism for visualizing and monitoring performance. ALMA came up with the “traffic light” scorecard design in 2012. In Tanzania, this idea was adapted by HISP Tanzania for the Maternal and Child Health (MCH) programme starting in 2013. This design went through several iterations, first as an external tool drawing on DHIS2 data, then as an HTML tool within DHIS2, and finally as a custom application. The reason for creating the scorecard within DHIS2 was to make it available not only to national-level stakeholders, but also to the health workers who are providing services–and who are already reporting data through DHIS2–so that they could measure their own performance and take informed actions to address gaps.
“They can use the scorecard because the color speaks loudly. If you see the color, you know exactly what level of performance you have.”
Charles Paul — HMIS Coordinator, MoH Tanzania
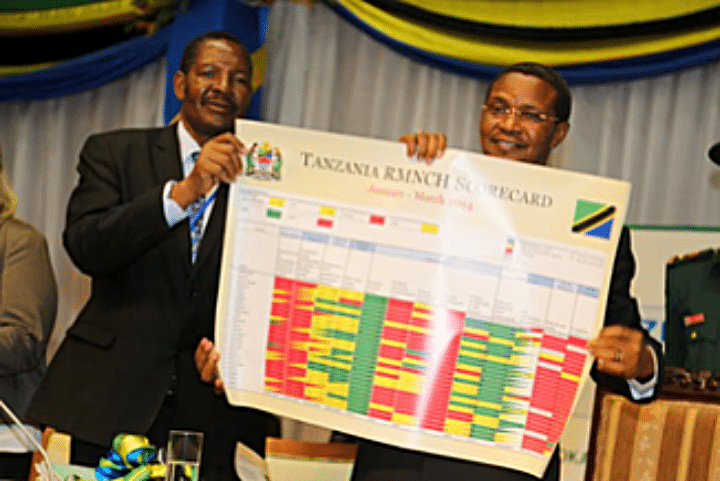
Tanzania’s first scorecard was for MCH. It went down to the district level and had multiple indicators, including pre-pregnancy, delivery, and postnatal outcomes, as well as data quality indicators like completeness and timeliness of reporting. This scorecard (called RMNCAH Scorecard) has brought great performance on MCH indicators as they were performing poorly but with de display of scorecard great improvement has been observed.
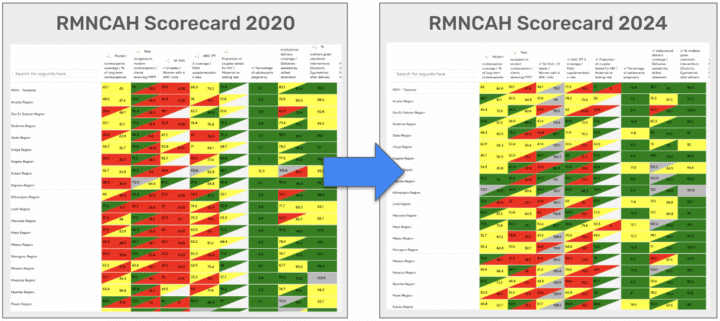
One of the key programmatic MCH indicators was maternal mortality rate, and the scorecard showed that some regions in Tanzania were not performing well. This stimulated action from political leaders, including follow-up down to the facility level and implementation of routine practices like audits of any of all maternal deaths, which have resulted in significant improvement in maternal mortality indicators. Through targeted interventions, maternal deaths due to negligence as well as infant mortality have decreased.
Institutionalizing the scorecard through regular performance review meetings has also helped improve data quality. For example, in the MCH program, there were several indicators related to reporting timeliness and completeness that were previously in the red for a large number of districts. Extra emphasis and effort were put into reporting improvements in these areas, and now they are green, indicating significant improvements in routine reporting since the scorecard was implemented. Having more complete and timely data makes programmatic indicators more reliable, which facilitates their usability for informing decision making.
Following the success of the MCH scorecard, several additional scorecards have been introduced in Tanzania’s DHIS2 system, including HIV, malaria, oral health, and more, and HISP Tanzania has supported the MoH in extending the use of the scorecard to the subnational level. Using scorecards has helped achieve drastic improvements in reporting timeliness across programs and regions.
UNICEF has also piloted the BNA app in several districts in Tanzania. Using this app has helped health teams identify specific problems and plan and budget actions to remedy them. For example, one district team determined that poor indicator performance for service delivery was actually due to stock-outs at a particular facility. The Scorecard app showed them the performance issue, while the BNA app let them drill down to see what was causing it.
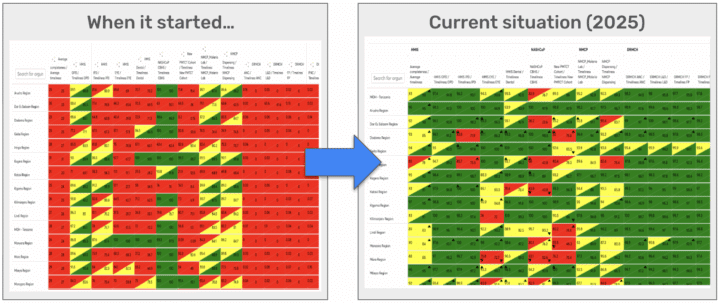
Tanzania’s National Tuberculosis and Leprosy Programme (NTLP) is another programme in the Ministry of Health that has achieved progress through effective scorecard use. The NTLP has been using DHIS2-based scorecards since 2020. Their scorecard draws on case-based and patient-level data collected at the facility level through DHIS2 Tracker programs. It allows programme staff to easily monitor 9 high priority indicators, such as new and relapsed cases, linkages between TB and HIV, and diagnostic and referral sources.
This scorecard is used for programme monitoring at all levels. District and regional offices and the national MoH–as well as implementing partners–have access, as do stakeholders at the health facility level. 54% of Tanzania’s 12,846 health facilities provide TB and Leprosy services, while 20% are TB diagnostic centers, which means that there is a large group of DHIS2 users who can access and use the scorecard for monitoring their results.
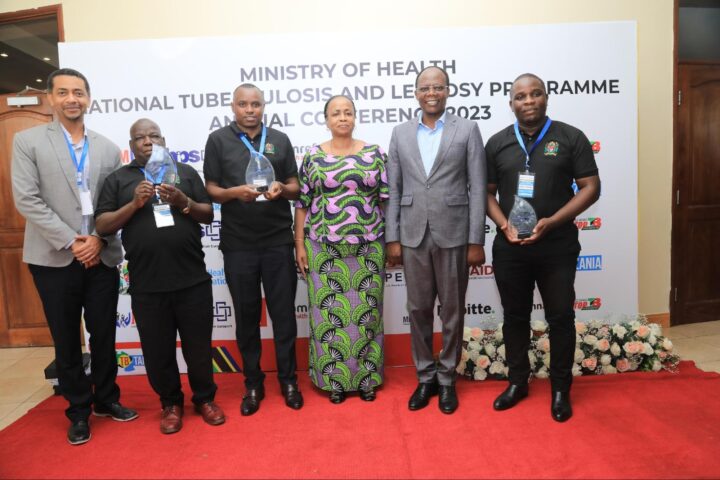
The NTLP scorecard is used for monthly reviews, as well as regional quarterly meetings and semiannual review meetings. The Scorecard also supports staff appraisal for District TB and Leprosy/HIV Coordinators (DTLCs), to identify and reward top performers on an annual basis.
Using the Scorecard has helped the NTLP achieve several key results. It has improved the visibility of program performance across all levels and facilitated the identification of high performing regions, districts, and health facilities. It has helped inform planning for targeted supportive supervision based on negative indicator trends, as well as planning and budgeting for health interventions. It has also strengthened data quality oversight by making it easier to identify issues, such as missing data, underreporting, or other issues.
The scorecard has also enabled monitoring of adherence to specific policy areas, such as the MoH’s policy that 100% of TB patients should have known HIV status, and that those who are HIV positive should be on Antiretroviral Therapy (ART). Through the scorecard, NTLP staff can quickly see which regions are adhering to this policy and which ones need additional support or follow up. This has helped us achieve higher overall results. For example, as of the end of 2025, 12 of 26 regions in Tanzania are achieving the target that 100% of TB patients should know their HIV status, while the majority of other regions are performing at 99%.
“Using the Scorecard, you can quickly pick out the high performing regions, districts, or facilities… and for regions that are flagged in red, we can plan for interventions or supervision for that region.”
Robert Balama — Data Manager, MoH Tanzania National Tuberculosis and Leprosy Programme (NTLP)
The deployment of the Scorecard has been an iterative process. The NTLP has reviewed and updated the indicators that are included based on some challenges that were identified. For example, they found that some outcome indicators, such as treatment success rate, were commonly misinterpreted due to different indicator timeframes, while indicators that showed ratios of key populations among leprosy cases caused underreporting, as health workers filling in the data wanted to avoid having the indicator appear red. These indicators were removed or changed in later versions of the Scorecard to reduce confusion.
Tanzania’s MoH has learned several key lessons through the process of implementing scorecards in DHIS2:
While using scorecards has helped achieve several clear improvements in data quality and programmatic indicators, there are also some ongoing challenges, including data quality gaps. There is also demand for enhanced functionality in the Scorecard app, such as features to support cross-group organization units and offline data review. On an organizational level, continuing to integrate scorecard outputs into supervision planning and performance review systems and expanding training to all stakeholders to ensure consistent use and interpretation across regions would also increase the impact of scorecard use.
Within Tanzania, the MoH aims to expand the use of DHIS2 scorecards into additional health areas and to integrate them within national performance frameworks. The use of scorecards has also gained momentum regionally through the East African Community (EAC). Countries like Uganda and Rwanda have already implemented DHIS2 scorecards for various programmes, and HISP Tanzania has recently been supporting Burundi with implementing a national-level scorecard. Overall, this project has helped the EAC and countries to standardize, view, and use their data within DHIS2 to achieve results and improve the performance of health programmes.
This article was based on a webinar hosted by HISP Tanzania in November 2025 on “Unlocking Insights with the DHIS2 Scorecard” and an interview with Dr. Wilfred Senyoni of HISP Tanzania.