Event clustering in GIS
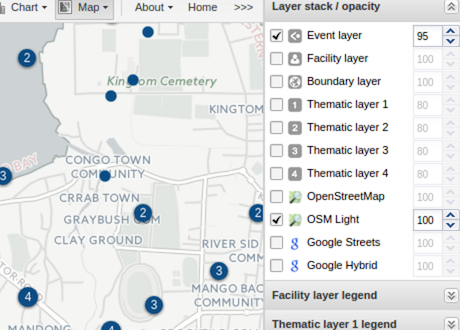
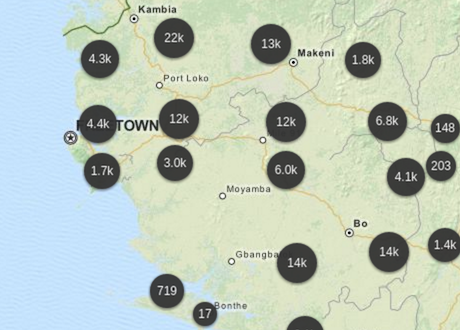
You can now view clusters of events in the event layer of the GIS app. This dramatically improves the scalability and lets you visualize millions of events in a single map. Try zooming in and see the clusters being updated. The event layer clusters are based on the longitude/latitude of the events which allows for geospatial analysis of disease outbreaks, surveys and more. Filters can be defined per data element, e.g. you can filter age groups and gender in a similar style as you do in event reports. After drilling down to individual events you can click on points to show a dialog with additional information about the event. You can select start and end dates or relative periods for the time dimension. The color and size of the clusters / points can be controlled under options.
