
The DHIS2 Annual Conference takes place from 15-18 June 2026! Learn more

The DHIS2 Annual Conference takes place from 15-18 June 2026! Learn more
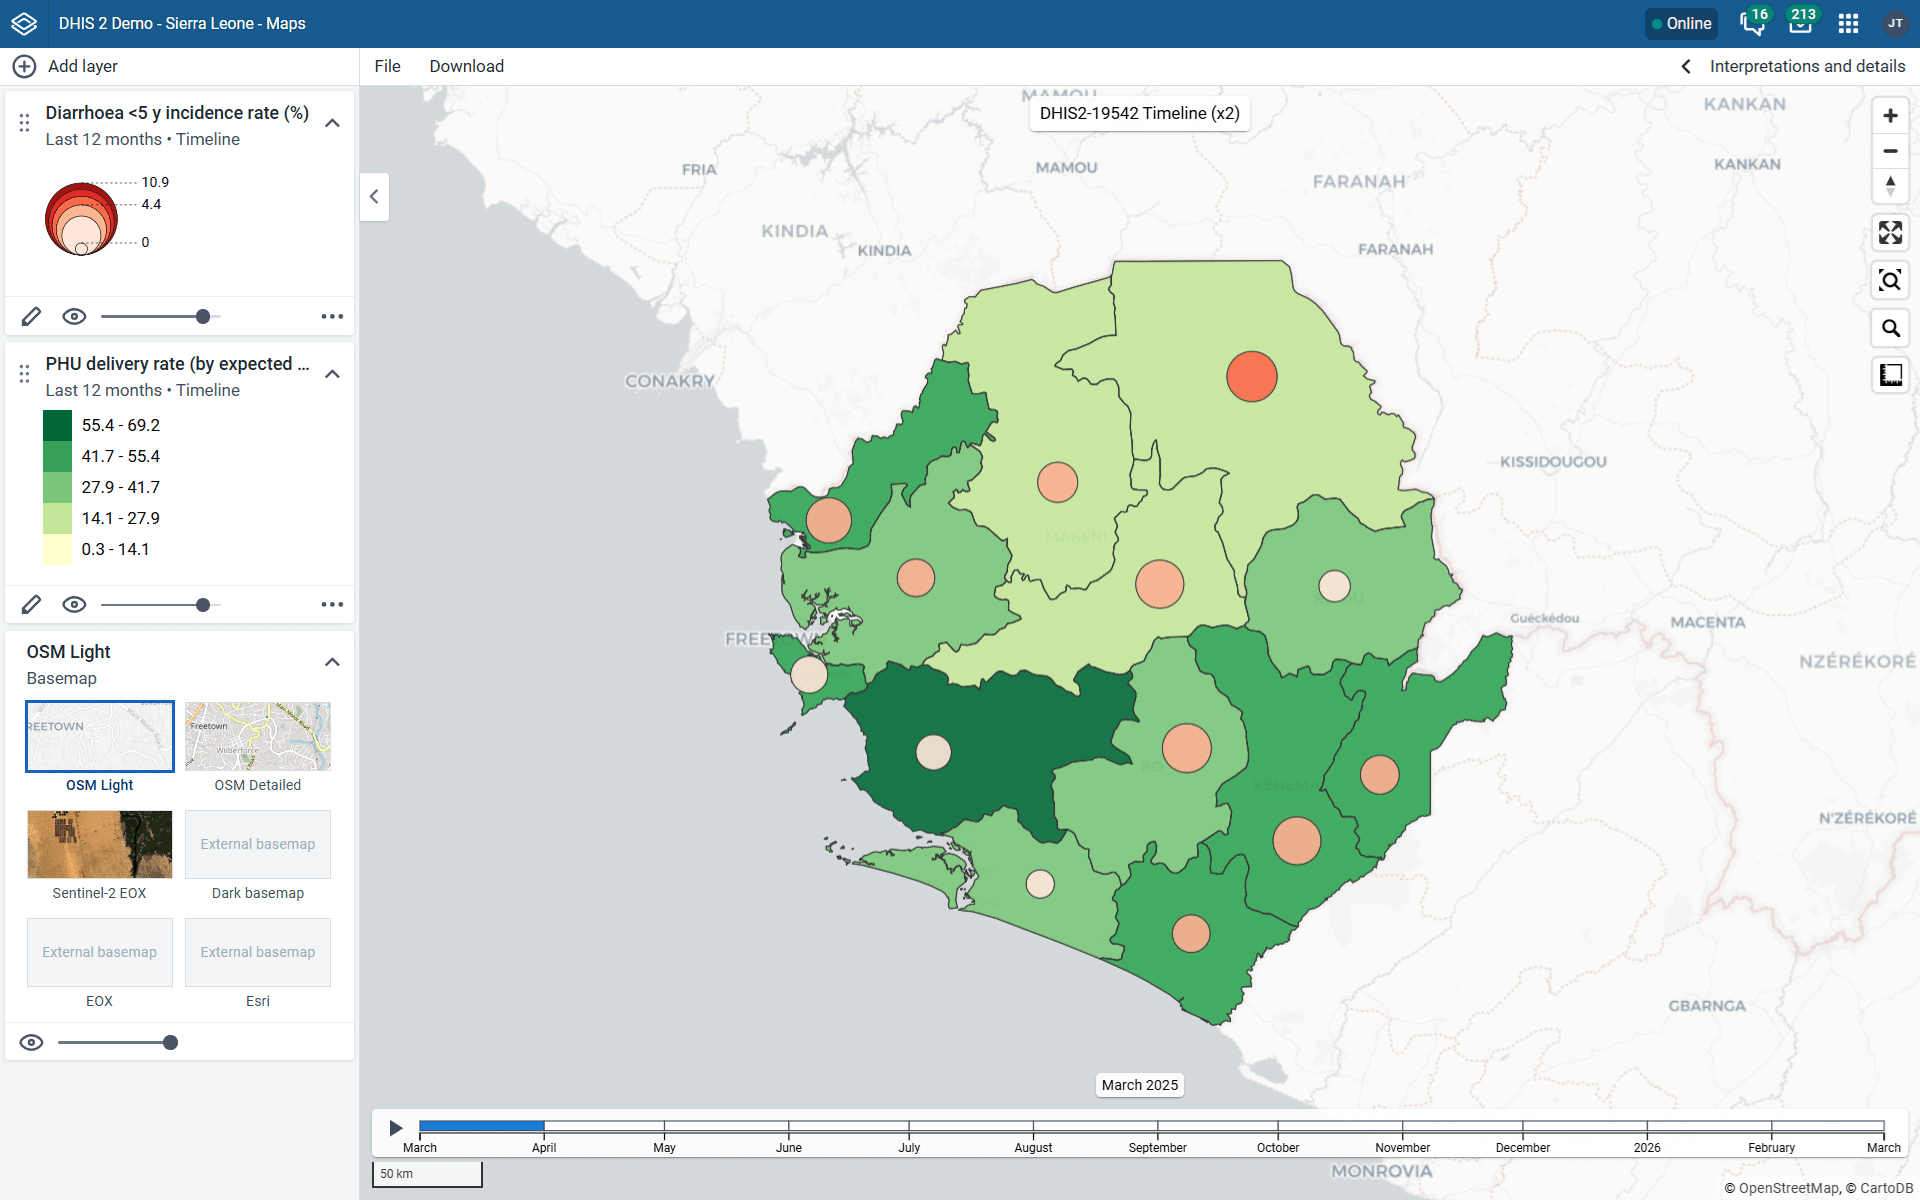
Discover how the DHIS2 Maps app helps you explore, analyze, and visualize data geographically—enhancing disease monitoring and response through powerful mapping tools and new features like climate data integration.
In this Feature Spotlight webinar, we will take a deep dive into the Maps app, which is a powerful tool for exploring, analyzing, and visualizing data geographically. Using examples from epidemiological surveillance, we will demonstrate how the Maps app can support disease monitoring and response.
The session will show how to visualize cases geographically with a combination of coordinates, styling, and filters, as well as how to combine multiple data layers and periods to understand the spread and context of an outbreak. We will highlight recently released functionality in the Maps app, such as improved period and data selection and new climate data layers that can complement your DHIS2 data for additional analysis.
Whether you are new to the Maps app or looking to get more out of its advanced features, this session will provide practical examples of how DHIS2 can support epidemiological surveillance and other use cases.
Reserve your spot today and join us to learn how the DHIS2 Maps app can enhance your disease surveillance and response efforts with practical mapping tools, improved data visualization, and powerful new features for smarter, data-driven decisions.