The DHIS2 Annual Conference takes place from 15-18 June 2026! Learn more
Supporting effective health data use in the Democratic Republic of the Congo with DHIS2
A Designing for Data Use research team led by HISP UiO and HISP WCA identified good data use practices, catalogued challenges, and proposed solutions that leverage DHIS2’s built-in analytics tools to make an impact on TB, Malaria, EPI and other health programs
Over the course of the past several years, HISP researchers at UiO have engaged in action research with various HISP groups and Ministries of Health to help identify barriers to data use, particularly at subnational levels. These research activities aim to facilitate targeted interventions to address the identified barriers, including the design of useful information products, addressing issues of missing data and capacity building on data analysis. In the last quarter of 2021, a team led by Professor Jørn Braa and HISP West and Central Africa (WCA) conducted an evaluation of the implementation of DHIS2 as a Health Management Information Systems (HMIS) in the Democratic Republic of the Congo (DRC). The team visited 5 health zones, health facilities and a number of HMIS stakeholders in Kinshasa and Haute Katanga provinces to study and evaluate DRC’s HMIS, with a focus on data use at all levels.
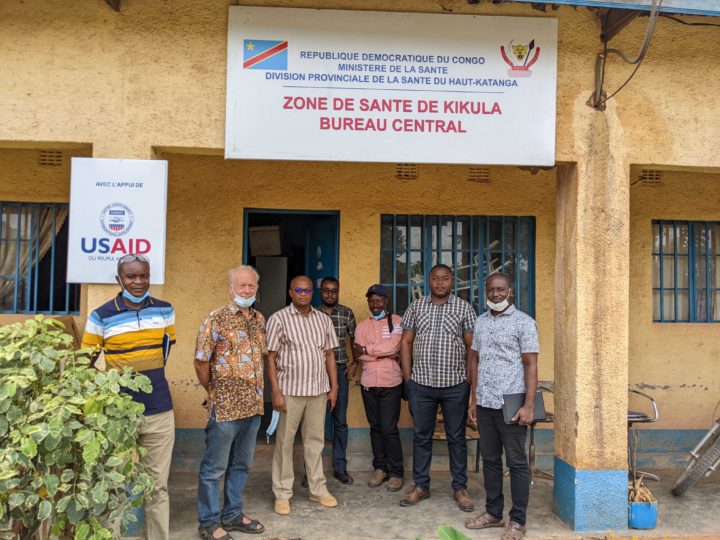
DHIS2 was implemented in the DRC as a national-scale HMIS in 2013 and has been utilized for health program planning and management at the zonal, provincial and national levels. This was made possible through the efforts of the government of DRC, HISP and partners including Gavi, Global Fund (GF), USAID, the CDC and MEASURE Evaluation (ME) among others, whose support for specific health programs such as Malaria, HIV, TB, and the Expanded Programme on Immunization (EPI) have contributed to strengthening DRC’s HMIS as a whole.
In evaluating the extent to which health data is used to support evidence-based decision-making in the DRC, the HISP research team found that while digital tools like DHIS2 were underutilized, both data entry and data use were taking place on a routine basis in Immunization, TB, Malaria and other health programs. This effective use of health data takes place despite several challenges faced by the HMIS division of the Ministry of Health, including fluctuating funding, organizational fragmentation, and infrastructure issues. The HISP team worked with local stakeholders to develop data analytics tools within DHIS2 to enhance DRC’s existing data use practices by improving data quality and increasing reporting efficiency.
Data collection: Achieving high standards of completeness despite infrastructure challenges
The DRC is a large country with a population of about 90 million people. The country’s vast land area is divided into 519 health zones across 26 provinces. Routine data on key indicators within the health zones are collected at healthcare facilities within each zone. Community health workers within a facility’s catchment area collect data on paper forms that are submitted to the facility, where they are collated with the facility’s other paper-based reports. At the end of a reporting period, facilities send their data on paper to the coordinating health zone office as part of a more elaborate report including data on program outcomes, stock management and disease surveillance. The reports are subsequently entered into the Système National d’Information Sanitaire (SNIS), the DRC’s national DHIS2 platform for health information management, in the health zones.
Though decentralized data entry into DHIS2 is available in some large healthcare facilities with reliable power supply and internet connectivity, most of the data entry is done centrally in the health zones. The team noted that in the sites visited, they have enough staff to do the data entry for all health facilities except in Kikula where only one staff member is primarily responsible for the task. A lack of tools such as internet-connected computers and power continues to hamper data entry in the facilities. Until the recent closure of its project in Kikula and Kapolowe, ME had funded the provision of laptops and monthly internet fees in 63 healthcare facilities for facility-based data entry. The experience was successful for about 2 years before the funding stopped and the devices deteriorated, without replacement or maintenance. This has demonstrated that with adequate funding, decentralized data entry in the facilities can be easily achieved, thereby improving the quality of data in the SNIS.
One example of data capture and use is the National Tuberculosis Control Program (PNLT), which relies on data routed collected at health diagnostic and treatment centers (CSDT) and entered into DHIS2 at the health zone level to monitor program performance. As at October 2021, data on TB infection, HIV/TB coinfection and treatment from 2061 CSDTs were routinely collected on standardized paper-based reporting forms – with a completeness rate of 92.8% in 2020 – validated at the centers, then forwarded to the Health Zones for entry into DHIS2. The DHIS2 data is exported to MS Excel where managers at the Health Zone level use it to support routine analysis and decision making. The situation is similar with programs such as EPI and Malaria, which use DHIS2 data to populate monthly reports that include assessments of completeness and timeliness, review of key indicators such as service delivery and concrete case detection, and concrete recommendations for action. At provincial and national levels, this gives program managers the larger picture, for example enabling the Malaria program to identify provinces with greater than 10% gaps between Malaria cases identified and cases treated and track stock-outs of Malaria supplies and plan targeted follow-up action.
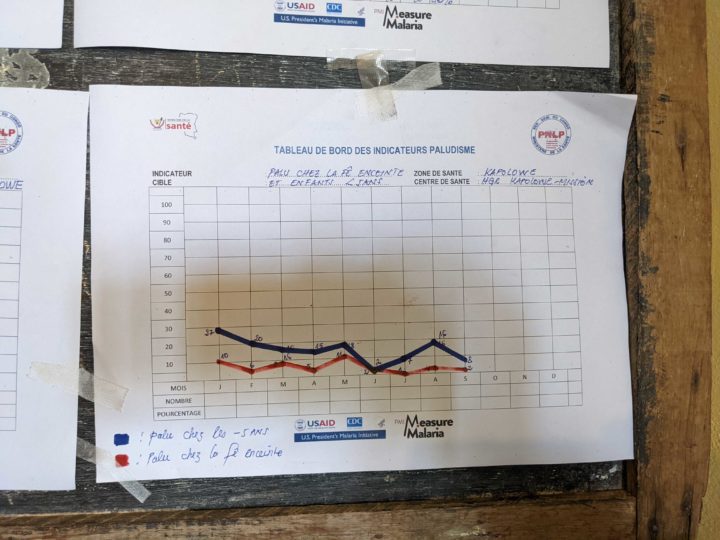
One challenge that the team observed with data collection was that some of the paper-based data entry tools used in the field were outdated compared to the current versions in the SNIS, including surveillance forms and the stock management section of EPI data sets. This compels CHWs and other users to draw additional columns to the forms by hand so that all required data is captured. In view of the limitations faced during data entry at the different levels, it is worthy of note that the data completion rate on the SNIS routinely surpasses the 80% benchmark for catchment areas, health zones and provinces. This is a testament to the good training and commitment of the HMIS team, and support by donors and technical partners in mobilizing resources and training to support these efforts.
Documenting good data use practices and supporting them with DHIS2 tools
While getting accurate data into DHIS2 on a regular basis is an accomplishment, the value of that data lies in the ability of program managers and other stakeholders to use it to evaluate performance and make decisions. In the DRC, the HISP research team found good practices at various levels for reviewing and validating data and using it to drive targeted actions:
- Data use culture at lower organizational levels: In the facilities and health zones visited, routine systematic practices aimed at utilizing available data were observed in the form of monthly meetings for data evaluation and performance monitoring. Data validation was carried out at facility and health area levels before data validation meetings at the zonal level with representatives from health areas. The data was analyzed and presented at the monthly monitoring meetings for discussion. Recommendations and action points generated from the meetings are used to drive actions in the facilities, health areas and zones, and actions from previous months are reviewed to measure compliance and evaluate impact. As one example, at the end of each quarter, the CSDT managers responsible for TB program monitoring analyze the TB data they have produced before transmitting the data to their health zone. Assessment at this level involves data quality review, evaluation of the cohort put on treatment a year earlier, assessment of anti-tuberculosis drugs and analysis of the key indicators of the PNLT.
- Improvisation for data analysis: DHIS2 is acclaimed as a highly versatile platform capable of performing complex analytics and presenting them as reports for ease of use. Owing to infrastructure limitations, most of the healthcare facilities do not have access to the country’s DHIS2 platform. At the health zones where both electricity and some internet connectivity are available, slow internet service, as well as poor server performance, often make data analysis tedious. In view of these hurdles, users frequently download data from DHIS2 and perform analysis offline in Microsoft Excel. This highlights the commitment by the HMIS teams to using their data, even when they are not able to do so in DHIS2 directly.
- Good documentation and record-keeping: The team also noted that the commendable data use culture that characterizes the use of DHIS2 in DRC is grounded in good documentation practices. The Documents Normatifs, which contain SOPs for data entry and use, serve as a reference in the facilities and the health zones where available. However, Professor Braa and his team found that the SOPs are rooted in the standalone system era where data took time to move from one level to another and only compiled data for the level directly below is available. Consequently, users at the coordinating facilities and health zones are only able to analyze their data relative to the units below them in the organizational unit hierarchy. The HISP research team found that data use for decision-making would be greatly improved by cross-level analysis to encourage peer review and knowledge exchange.
Adapting and improving local offline analytics tools into DHIS2
The HMIS team members in the DRC are enthusiastic about data use at the various levels visited by the research team. However, as the HISP research team noted, there are issues with data entry and validation that have had a negative impact on data quality and limited the ability to use data. For example, errors arising from data collection on paper or manual entry into DHIS2 have resulted in inaccurate results capable of misguiding the direction of policy interventions. One example of errors arising from faulty validation at the lower levels was a report of 17,000 new cases of tuberculosis recorded in one facility in a single month. This error was only detected at the national level, having gone through the facility, health zone and provincial levels undetected. DHIS2 data quality tools such as validation rules that can help validate and fix these erroneous values are already in place in the DRC system, but the routines around their use need to be strengthened.
The quality of data from manual analyses, which the users resorted to as a result of infrastructure challenges, was further degraded by missing population data at the healthcare facilities. Most of the visited facilities did not have allocated catchment population data. A few other facilities have their own population targets for antigens coverage that were developed by the EPI Programme. Collectively, these challenges frustrate users of the SNIS and significantly limit the DHIS2 potential in the DRC.
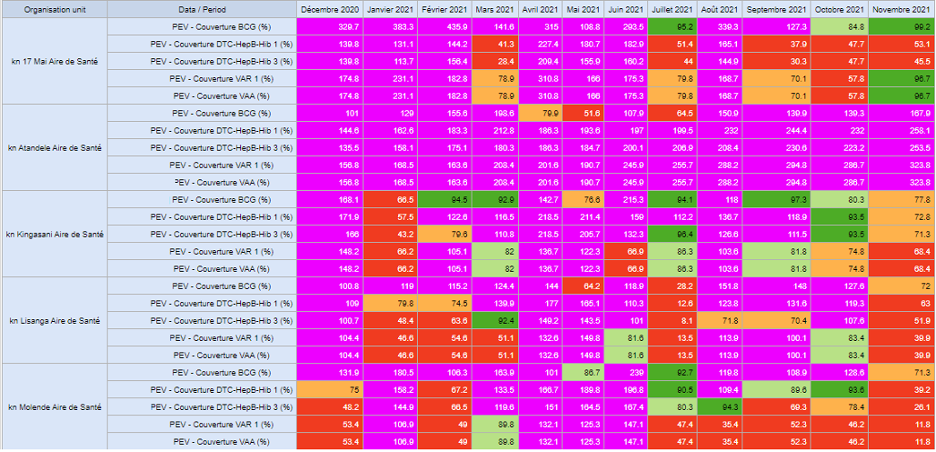
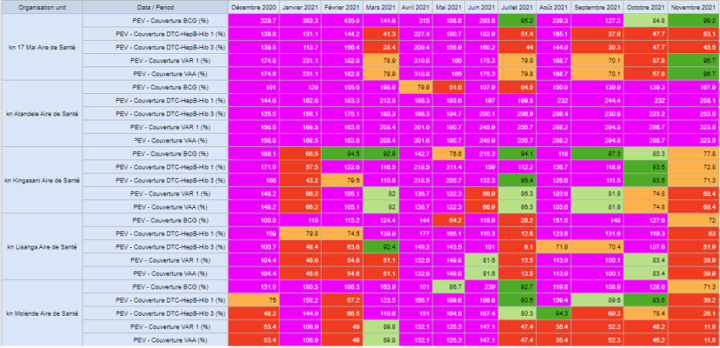
Using these population targets, where available, and a calculated proportion of the catchment population for other facilities as denominators, the HISP research team developed prototype tools in Excel that simplified offline data analysis in the facilities and health zones, thereby boosting data use efforts and enhancing the quality of the data. Some of these tools include scorecards for service coverage at facility and district levels. The team subsequently built dashboards in DHIS2 showing facility performance over a 12-month period by calculating indicators such as dropout rates, service coverage among others. These dynamic dashboards eliminated the need for users to continue the manual method of downloading the data from DHIS2 and calculating for indicators using MS Excel, as the visualizations are updated automatically when data for a new month is entered into the DHIS2 system. This makes life easier for local users and improves data quality, as validation errors that previously resulted in poor quality data can also be identified and resolved locally using built-in DHIS2 tools. The research team hopes that these prototypes could be further adapted to other zones in the country.
Additionally, the research team noted that some of the paper-based tools for data collection as well as guides for their analyses were outdated. Examples include annexes of the Documents Normatifs relating to HMIS management and operations, among others. Consequently, the team suggests that governance and procedure guidelines, SOPs and data collection forms should be updated to reflect current practice guidelines. Where applicable, paper-based forms could be replaced with digital tools for easy enforcement of data quality compliance rules.
Remaining challenges and next steps
The HISP research team identified several remaining challenges that restrict the use of these DHIS2 tools in the DRC. Limited infrastructure leads to data entry being largely centralized, and workers at the facility and zonal levels frequently have inadequate data analysis skills to gain insights from available data. In addition, the country’s governance structure, with different Ministries working in silos, makes coordination difficult.
In order to solve these challenges, there is a need for a clear delineation of duties and responsibilities among the departments and agencies. Regular stakeholders’ coordination meetings to monitor the HMIS strengthening plan, manage needs and coordinate HIS initiatives and resource mobilization would also foster collaboration and minimize conflicts. Finally, data quality and use, especially at the lower government levels such as the facilities and zones, would improve with decentralization of data collection, and data analytics capacity development, as well as improvements to infrastructure.
Despite many challenges, the DHIS2-based national HMIS in the DRC is largely a success story. The system has been helpful in managing many healthcare programs – including TB, Malaria and EPI – by supporting timely and complete data collection and data-driven decision making. With sustained support from the government of DRC, along with funding and implementing partners, health data use at all levels of the program has improved over the years. While limited infrastructure, lack of key skills in data analytics and administrative bottlenecks limit full utilization of the systems, recommendations made by the Design and Data Use team from HISP UiO and HISP WCA would improve efficiency, boost data quality and build capacity for greater decentralized HIS data use in the DRC.
