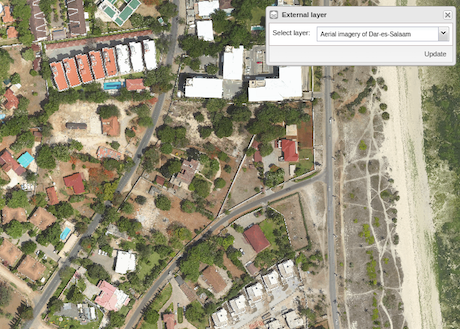
The DHIS2 Annual Conference will take place from 12-15 June! Learn More & Register
DHIS 2.25 Overview
Explore DHIS2 version 2.25, which includes many new features, apps, improvements, and bug fixes. On this page you can find information on this software version, including feature descriptions, links to technical documentation, and more
Jump to a section on this page
Analytics Features

External map layers
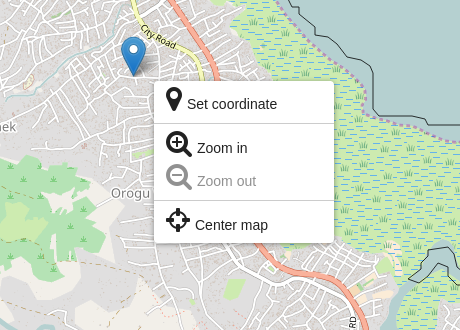
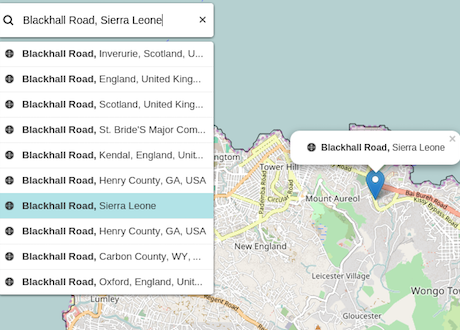
The GIS app now supports TMS (Tile Map Service), XYZ and WMS (Web Map Service) layers. These are all popular protocols for map data and there are numerous map services available, allowing you to display maps for rivers, roads, weather, land data and everything else. External map layers can be set up from the Maintenance app, and then be accessed from the top bar in the GIS app.
[Screenshot 1 | 2 | 3 | Setup ] [ Demo 1 | 2] [Documentation GIS ] [ Documentation setup]

Push analysis
You can now push data analysis in the form of reports, charts and maps to your users over email. This allows for improving awareness and visibility of your data, and can encourage people to more actively look at analysis. Push analysis is based
on dashboards, and can be set up, run and scheduled from the Maintenance app. You can also run immediately and preview from the the context menu.
[Screenshot 1 | 2 ]
[ Demo ] [Documentation]

Indicator as filter
A single indicator or data set reporting rate can now be used as filter in charts and pivots. This allow you to create charts for example with multiple periods and organisation units.
[ Screenshot ] [ Demo ] [ Documentation ]

Dashboard translations
The names of dashboards can now be translated, meaning you can have dashboard names appear in user’s local language.
[ Screenshot ] [ Documentation ]

Deep linking of favorites
When opening favorites in the Pivot Table and Visualizer apps, the browser address bar URL will reflect the current favorite. This allows for easy sharing of favorites through copy-and-pasting the URL.
[ Screenshot ] [ Demo ]

Chart rendering
The chart rendering engine has been rewritten from scratch and now looks better, renders faster and will allow for new chart types in the coming releases. The Data Visualizer app’s favorite solution has also been upgraded.
[ Screenshot ] [ Demo ]

Favorite description
You can now specify description for pivot table and chart favorites. This allows you to add more information such as the purpose and method to interpret the analysis favorite. You can also store titles for pivot tables. Click rename to change it.
[ Screenshot ] [ Demo ]

Interpretations in analytics apps
The Pivot Table and Visualizer apps now have a right-side panel where you can see details and interpretations for the current favorite. Click the right-side arrow to open the panel.
[ Screenshot ] [ Demo ] [ Documentation ]

Data analytics export as raw data
The analytics API now lets you produce aggregated data exports in the raw data value set format. This is useful for data exchange, e.g. you can aggregate data in a source system from facility to district and from months to quarters, and combine
data elements using aggregate indicators or program indicators, before importing as raw data values in the destination system. You can try it out using the Pivot table app from Download > Advanced > Data value set XML.
[ Screenshot ] [ Demo ] [ Documentation ]
General Features

Flexible disaggregation
Data elements can now be disaggregated differently for each data set they are part of. Put differently, a data element can be linked to multiple category combinations. When assigning a data element to a data set, you can define which category
combination to use. This is useful in order to reuse data elements, for instance when different provinces in a country employ different data disaggregation, or when the disaggregation change from year to year.
Screenshot Setup | Screenshot Form 1 | Form 2 ] [ Demo ] [ Documentation ]

Soft data value delete
Data values are now “softly” deleted, meaning they are marked as deleted in the database rather than permanently removed. A new field deleted has been introduced for data values which is set to true for deleted values. Softly deleted data can
optionally be included when requesting data through the API by setting the includeDeleted param to true. This allows clients, such as Android apps and third-party systems, to react when data has been deleted in DHIS 2.
[ Documentation ]

Data value audit
The data value import process now generates data value audit records. This allows for proper auditing of data being ingested from bulk data imports.
[ Documentation ]

Predictors
A new data predictor feature allows you to generate data values based on an expression and several other parameters. This is useful for generating targets, thresholds and predicted data in the future.
[ Demo ] [ Documentation ]

Profile
The profile section has been rewritten and has received the new and modern look.
[ Demo ] [ Documentation ]

Maintenance
The Maintenance app now includes configuration of tracked entity attributes, tracked entity attribute groups, relationship types and tracked entities.
[ Demo ] [ Documentation ]
Tracker Features

Reminders and notifications
A new notification solution allows for setting up reminders for upcoming events and notifications for missed events in tracker programs. Reminders can be sent before and after scheduled events, directly to people and DHIS2 users. Also, notifications
can be sent on program enrollments and enrollment completion. Messages can be delivered by SMS, email and as DHIS2 messages.
[ Screenshot 1 | 2 | 3 ] [ Documentation ]

Organisation unit value type
A new value type organisation unit has been introduced, allowing you to select organisation units for attributes and data elements in Event Capture and Tracker Capture apps. This means that you can associate multiple organisation units
to an event which is useful e.g. to store place of infection in addition to place of treatment. Try it out with the Inpatient morbidity mortality program.
[ Screenshot ] [ Demo ] [ Documentation ]

Capture location of enrollment
You can now capture the coordinate / location of an enrollment. This allows you to know where an enrollment took place. The location map widget is based on OpenStreetMap. This can be enabled through the capture coordinates property in program
maintenance.
[ Screenshot ]

Mapzen-based location search
In the location map widget you can now search for most addresses in the world and store the coordinate of the location. Click the magnifier icon in the top left corner of the map widget and start typing your address. Try it out by clicking register,
then click on the get from map icon next to coordinate.
[ Screenshot ] [ Demo ]

Deletion of tracked entity instances
Tracked entity instances can now be permanently deleted. This means all related records, including enrollments, events and audit records will be removed.
[ Screenshot ]

Messaging widget
The tracker person dashboard now has a messaging widget which allows for sending messages directly to the person using email or SMS. The contact info is automatically fetched from the person profile, and can also be specified directly in the widget.
[ Screenshot ] [ Demo ] [ Documentation ]

Locking for completed events
Completed events can now be automatically locked for further modification after a given number of days. This can be configured per program through the completed events expiry days field. For example: if expiry days is set to 7, then events which
have been completed more than 7 days ago can no longer be edited.
[ Documentation ]

Event locking per program
In the Event Capture and Tracker Capture apps, time periods can be locked in order to prevent new events to be added. This is configurable through the expiry days and expiry period type properties, which controls the number of days
after a period of a specific period type for which events can still be added. For example: if expiry days is 7 and expiry period type is monthly; new events can be added for a month up to 7 days after the end date of that month.
[ Documentation ]

Configurable columns
In the Tracker Capture app, the columns to display in the list of tracked entity instances can be selected and remembered per user. In the Event Capture app, the columns to display in the list of events can be selected.
[ Screenshot 1 | 2 ] [ Documentation ]
Hosting Features
Web server clustering
This release allows for deploying DHIS2 in a web server cluster. When configured appropriately, each node in the cluster will ensure that the application caches of the other nodes are kept in sync. Up to 5 nodes can be configured, allowing for
web server horizontal scalability. For each node, the hostname of the other nodes must be configured.
[ Screenshot ] [ Demo ] [ Documentation ]
Database read replication
DHIS2 now allows for configuring up to 5 read replicas of the master database. When set up, the application will automatically offload read-only database queries to the read replicas, allowing for horizontal scalability of the database read operation
capacity. Each read replica must be specified in the dhis.conf configuration file.
[ Demo ] [ Documentation ]
WEB API Features
API versioning
The Web API is now versioned. The versioning is defined through the request URL with a version number. For example /api/25/dataElements will return version 25 of the data elements resource. If you omit the version part
of the URL, the system will use the current API version. The last three versions of the API will be supported.
[ Documentation ]
Indicator analytics
The numerator, denominator and factor components of indicator values can be included separately in analytics responses by setting the includeNumDen parameter to true.
[ Documentation ]
Translation in metadata export
Object translations can now be included in the metadata export payload by setting the translate parameter to true.
[ Documentation ]
Async metadata import
Metadata imports can now be performed asynchronously by setting the async parameter to true, which is useful for large metadata imports.
[ Documentation ]
Logical operators
You can now specify whether to use the AND or OR logical operators for filters while using the metadata export resources.
[ Documentation ]
Release Information
Click on the links in the table below for more information about this software release.
To find more details about... | Follow this link: |
---|---|
Download release and sample database | Downloads |
Documentation | Documentation |
Upgrade notes | Upgrade |
Source code on Github | DHIS2 source code |
DHIS2 community | DHIS2 Community of Practice |