Go to the main page

The DHIS2 Annual Conference will take place from 10-13 June 2024! Learn more & register

DHIS 2.26 Overview

Explore DHIS2 version 2.26, which includes many new features, apps, improvements, and bug fixes. On this page you can find information on this software version, including feature descriptions, links to technical documentation, and more

Jump to a section on this page

    Analytics Features

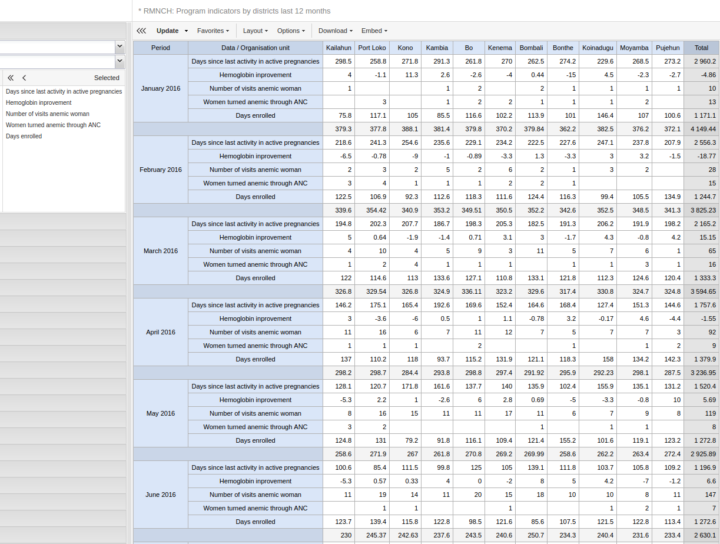
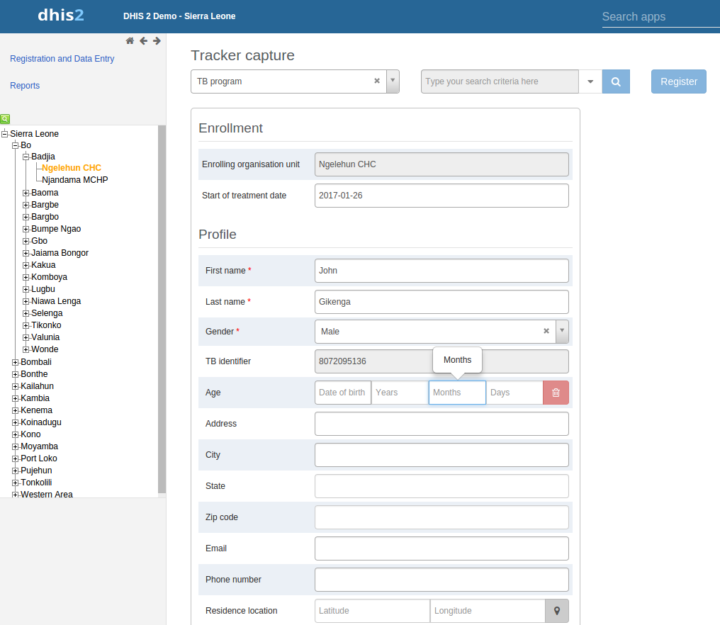
    Enrollment analytics

    Program indicators can now utilize a new aspect of the analytics engine for program enrollments. This implies that you can compare data values and dates from different stages and events within an enrollment. This allows for calculation of indicators such as “average inpatient bed days” and “hemoglobin improvement since first visit”.

    Demo ] [ Screenshot ] [Documentation ]

    Daily relative periods

    You can now push data analysis in the form of reports, charts and maps to your users via email. This helps improve awareness and visibility of your data, and can encourage people to more actively look at analysis. Push analysis is based on dashboards, and can be set up, run and scheduled from the Maintenance app. You can also run this immediately and preview from the the context menu.

    Screenshot] [Demo 1 | 2 ]

    Data element event clustering in GIS

    Using the event layer in the GIS app, you can now specify which data element or attribute to use as basis for event analytics and clustering. The data item must be of value type coordinate. As an example, for a malaria case program, you can have data elements of type coordinate for place of infection and household location, and visualize those locations on the map for the malaria cases.

    Screenshot] [Docs ]

    Pivot table cell background coloring

    You can now specify whether to color the cell text or cell background of pivot tables based on legend sets. This allows e.g. for creating scorecards, where high and low values easily can be identified. Go to Pivot table > Options > Legend display style.

    Screenshot] [Docs ]

    Analytics group sub-hierarchy inclusion

    Org unit group sets have a new option for including the sub-hierarchy of organisation units in groups when aggregating data in analytics apps. This can simplify org unit management when there are many org units at the bottom of the hierarchy which should all belong to an org unit higher up in the hierarchy. As an example, you can create additional hierarchies by grouping all facilities in multiple districts together in a group, then assign the new groups to an org unit group set.

    Screenshot 12 ] [Docs ]

    GIS improvements

    Labels are positioned smarter on the map to avoid collisions. Interactivity on boundary layer is disabled when combined with thematic layer. Automatic color scales for thematic maps can be flipped (i.e. low to high vs high to low).

    Screenshot]

    Most viewed favorites

    The opening screen of the pivot table apps now displays link to the top 10 most viewed favorites for the current user. This provides you with quick access to your most relevant data.

    Screenshot ]

    Expected reports in analytics

    In reporting rate analytics in pivots and charts, the number of expected reports are always shown even if no completeness registrations exist.

    Screenshot ]

    Better interpretations

    The interpretations app has been rewritten and now provides support for event reports and event charts, using the dynamic visualization plugins and provides a better commenting solution.

    Screenshot ]

    Analytics performance improvements

    Analytics table generation and analytics queries performance has been significantly improved. Depending on the system configuration, the improvement is in the range of 20 to 40%.

    General Features

    Explicit open periods for data entry

    You can now specify exactly which periods should be open for data entry per data set. You can also determine when those periods will be made available for data entry. This is useful when you need finer control over which periods should be possible to enter data for, and when you need to schedule these periods to open at precise times.

    Screenshot] [ Documentation]

    Validation notification templates

    You can now specify templates for notifications which are to be sent for data validation violations. The templates gives you full control over the notification text and supports variables for injecting the org unit name, period, validation rule and current date.

    Demo ] [ Screenshot ] [ Documentation ]

    Event data in validation rules

    You can now use program data elements, tracked entity attributes and program indicators inside validation rules. Aggregated values will be utilized from the event analytics engine when the validation rules’ expressions are evaluated. This allows for combining routine data and event data in the same validation rule. This is useful for comparing thresholds collected as routine data with disease cases reported as events, for example. Validation rule management is now available in the Maintenance app.

    Demo ] [ Screenshot ] [ Documentation ]

    Translations app

    We’ve now included a new app for translating database content in bulk. You can translate lots of metadata much faster by selecting the object type, then translating all objects from within a list. Open it from Apps > Translations.

    Demo ] [ Screenshot ]

    Category combination metadata export

    The metadata export with dependencies now supports the export of category combinations, which will include all related category objects. This is useful when exchanging metadata between instances.

    Demo ] [ Screenshot ]

    Auto-select single options in data entry

    In the Data Entry app, when the data set or category selections only have one option, that option is automatically selected. This makes data entry more efficient.

    Screenshot ]

    Automatic totals in section forms

    Section forms can be configured to display totals for columns and rows in aggregate data entry. Set it up from Maintenance > Data sets > sections. Check out the “reproductive health” data set on the demo.

    Demo ] [ Screenshot ] [ Documentation ]

    Assign message to user

    In the Messaging app, a message can now be assigned to a DHIS2 user. This allows you to treat messages as support tickets and assign them to users (agents). Note that this feature is only available to users belonging to the “feedback recipient” user group.

    Demo ] [ Screenshot ] [ Documentation ]

    Tracker Features

    Age value type

    Data elements and attributes support a new value type: “Age”. This renders as a widget in Event/Tracker Capture apps and means you have to enter the age in weeks, months or years. The selected input converts to a date of birth. This simplifies the input of age at points of care, for example.

    [Screenshot]

    Google base maps for coordinate picker

    When capturing coordinates in Event Capture and Tracker Capture, you can now switch between using Google Maps and OpenStreetMap as a base map.

    Screenshot ]

    Hide program stage program rule action

    Program rules now support an action for hiding program stages. This is useful for disease case investigations, for example, where various stages are relevant only for certain diseases.

    Screenshot ]

    System Administration Features

    Analytics cache of old data

    We’ve added a new system setting for the caching of analytics data, where data older than a specified number of years will be cached. You can avoid caching your latest data, while older data that never changes, can be cached.

    [ Documentation ]

    Public/private analytics cache setting

    There’s a new system setting for controlling whether cached analytics data should be public or private, meaning whether proxies should be able to cache the content. This is useful for heightening the security of sensitive data while still allowing web browsers to cache content.

    Documentation ]

    Approval in analytics threshold setting

    We’ve added a system setting which defines for how many years back in time approval should be relevant. After the specified number of years, all data becomes available in analytics – even if unapproved. This means that data will automatically be approved and visible after a given number of years. This enables you to prune the approval table and ensure that system performance is not degrading.

    [ Documentation ]

    Env variables in config

    Environment variables are now supported in the dhis.conf configuration file. You can use this for example to externalize database connection information such as URLs, user and password, instead of storing this data directly in the config file. This is useful for server administration and for cloud environments.

    [ Documentation ]

    User account lockout

    The system now supports locking the user account for 15 minutes after five successive failed login attempts. This is useful to prevent brute-force authentication attacks.

    Documentation ]

    Configurable session timeout

    The session timeout can now be configured from the dhis.conf configuration file. This is useful to comply with specific security regulations.

    Documentation ]

    WEB API Features

    Analytics raw data

    We’ve introduced a new resource for retrieving analytical data without aggregation at /api/analytics/rawData. This resource lets you retrieve raw data denormalized across any data dimension. This is useful when integrating third-party BI/analytics tools, as you will get data values with all data dimensions “flattened out” without any pre-aggregation, allowing the external tool to perform the aggregation and filtering.

    Documentation ]

    Pre-aggregation measures in analytics

    The analytics API lets you specify measure criteria to be applied before data aggregation takes place. This allows for better filtering of data before aggregating.

    Documentation ]

    Filter operators in SQL views

    You can now use the fields filtering syntax known from the metadata API on SQL views. This allows you to fetch only the fields (columns) you are interested in from large SQL views.

    Demo ][ Documentation ]

    Prune data element

    Data elements with corresponding data and audit values can be pruned using the /api/maintenance/dataPruning resource.

    Documentation ]

    Data set completeness exchange

    The API resource for import and export of data set completeness records has been rewritten and is now a lot more scalable and supports more features for controlling what to exchange.

    Documentation ]

    Soft event delete

    Events are now deleted “softly”, meaning marked as deleted instead of being removed in the database. The events resource can include deleted events in the response, allowing clients to handle events which have been deleted on the server.

    Demo ] [ Documentation ]

    Release Information

    Click on the links in the table below for more information about this software release.

    To find more details about...Follow this link:
    Download release and sample databaseDownloads
    DocumentationDocumentation
    Upgrade notesUpgrade
    Source code on GithubDHIS2 source code
    DHIS2 communityDHIS2 Community of Practice