Improving Immunization Data Capture and Use in Zambia
HISP South Africa supports Zambia’s Expanded Program on Immunization (EPI) by strengthening the collection, analysis and use of immunization data through capacity building and exploring advanced population tools in DHIS2
Child morbidity and mortality in Zambia is mainly due to vaccine-preventable diseases. Although numerous interventions have tried to increase immunization coverage, full coverage remains relatively low. HISP South Africa was contracted by GAVI, The Vaccine Alliance, to support the Zambia Expanded Program on Immunization (EPI) optimization initiative by strengthening the collection, analysis and use of immunization data. This work, which began in 2020, has initially focused on the Chinsali district, and includes capacity building through online courses customized for the EPI program and local context and exploration of the use of advanced population tools in DHIS2.
Addressing issues of data capture, quality and use and developing team spirit through online capacity building
Reliable and timely health information is an essential foundation for public health action. The use of a robust Health Management Information System (HMIS) is a key tool to ensure valid, reliable data and information is available where and when needed for evidence-based decision-making and effective health programs, including EPI. In Zambia, DHIS2 (and previously DHIS version 1) have been used as the national routine HMIS since 2006.
Each district in Zambia has access to DHIS2. However, the use of DHIS2 for immunization programs in Zambia has generally been limited, and in Chinsali district, Muchinga Province, it was not being used at all. This situation was due to the combination of several factors, including low computer literacy skills, unstable internet connections and unavailability of data bundles, and limited access to laptops.
To improve EPI data capture, analysis, presentation and use, and thus help to improve EPI program outcomes, HISP South Africa trained staff in all Chinsali District facilities to improve facility-level data capture in DHIS2. This included training data entry personnel; information officers; provincial, district and facility staff and EPI managers to improve the following areas:
- Access to data, using existing systems and app to identify gaps and bottlenecks
- Use of data to monitor immunization outcomes at facility level
- Staff ability to ensure data quality in the DHIS2
These trainings were initially planned to be carried out in person, but the COVID-19 pandemic made this impossible. HISP South Africa quickly adapted and pivoted the training to a online format consisting of the following courses and materials:
- A training of the trainers (ToT), to train staff from the DHMT as master trainers
- An EPI Foundation Course, developed with support from the district EPI monitoring and evaluation unit and the Ministry of Health
- Seven EPI videos created by HISP South Africa that included practical exercises based on the local context of Chinsali District
To support ToTs and course participants, HISP South Africa provided clear agendas, guidelines and ongoing support through Zoom meetings and WhatsApp. Two dedicated course administrators supervised the running of the online course and provided support to ToT participants. A six-week ToT training and a 10-week EPI Foundation training course were held. 91% of the students (58 of 64) successfully completed the training program, including at least two staff members from each facility and eight from the District Health Management Team.
As a result of these courses, EPI data is now being captured at all 16 facilities in Chinsali. The staff have a better understanding of data collection, data quality and what this information is used for. They also have the tools to better analyze the information and process it much faster. There is a project manager for the program who supports the facilities with programmatic and information management issues. In addition, bringing these different teams together for training — even in an online context, thanks to discussion groups between facilities and districts—helped them develop a stronger team spirit and improved morale.
HISP South Africa’s experience in Chinsali district shows that online DHIS2 training can lead to clear improvements in DHIS2 use, particularly with the involvement of local trainers, MoH and local support, structuring courses as team-based training with voluntary participation, and producing short, simple and engaging content that includes material tailored to the local context.
Next steps: Improving population denominator data availability, accuracy, and use at the facility level with advanced population mapping tools in DHIS2
In Zambia, the HMIS is the nation’s routine data collection instance across all public health activities and diseases, with symptom and service delivery data collected monthly at the health facility level. Both service-based indicators and officially projected population data (from the 2010 census) is provided by ZamStats and used at national, provincial, and district levels to calculate target indicators in DHIS2.
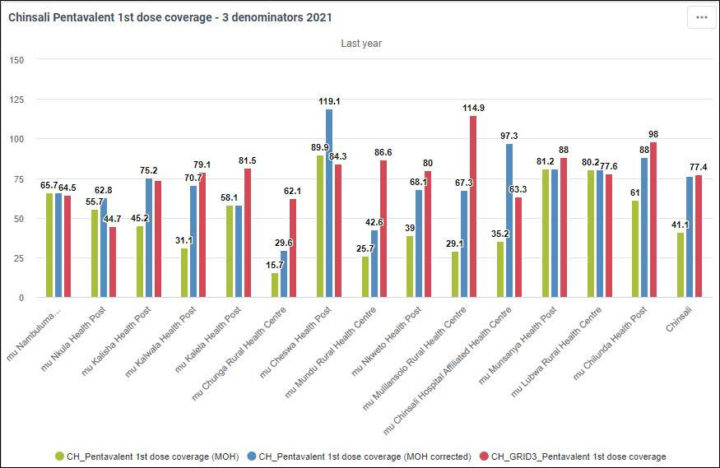
Several challenges arise when using this official population data. One is the age of the data and related demographic calculations: Zambia’s population has grown significantly in urban areas since the last census, and age group multipliers in population projections have not been updated since 1992. In addition, disaggregated population data is not available at the health facility catchment area level – instead, facility headcount data is used. However, when aggregated, the headcount data does not match the corresponding district population data. This results in misleading indicators at the national level (such as the percentage of fully vaccinated children), with coverage rates of 100% or above due to population denominators based on the official census being significantly lower than the actual population.
Meanwhile, at the facility level, no harmonized or documented methodology for calculating headcount-based catchment populations exists, meaning that the quality of these population denominators (and the indicators that are based on them) varies from facility to facility, and it is difficult to compare their accuracy against the official population numbers used at the higher levels of the MoH hierarchy.
Currently, HMIS work at the facility level is largely paper-based, with data captured on standardized paper forms on a daily basis, tallied up in daily and weekly tally sheets, then further aggregated into monthly forms which are sent to the district office for entry into DHIS2. This paper-based process makes timely data use difficult. At the few facilities that enter data directly into DHIS2, the staff may not have the skills or system access to analyze it. In both cases, quality issues with catchment population data would call into question the accuracy of analysis based on facility-level indicators.
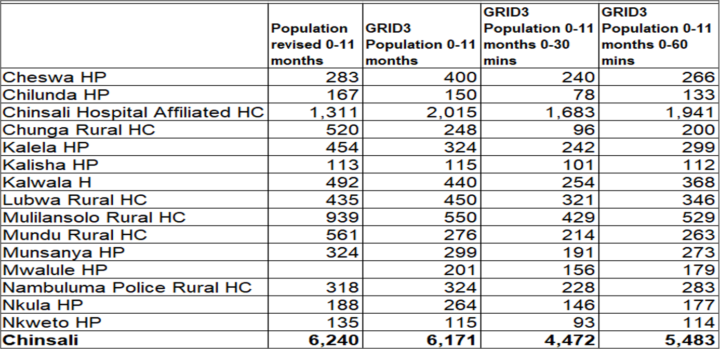
Recent developments in geospatial data and mapping technology offer several potential solutions to the population data problems in Zambia’s HMIS. Through the National Spatial Data Infrastructure Committee (NSDI) and the Grid3 project, core geodata sets are available and accessible in Zambia. Grid3 supported ZamStats in modeling of population data using available household survey data, including data from census cartography and satellite imagery, using algorithms to generate population estimates based on building structures. The resulting “bottom-up population estimates” are modeled to a fine resolution of 100m by 100m, allowing them to be aggregated to health facility and district boundaries.
HISP South Africa has been working with the EPI program in Chinsali district on incorporating Grid3 population maps into their sub-facility-level micro-planning process, which now uses this visual and population data to review geographic accessibility, identify hard-to-reach communities, and plan new outreach sites. HISP South Africa has successfully incorporated Grid3 data into Zambia’s test DHIS2 instance, where it can be used with health service delivery and symptom data to calculate facility-level indicators. This has already led to a better understanding of immunization coverage in Chinsali.
On a national level, Zambia has recently started population geodata in public health. For example, geodata has been used in the micro-planning of vector control measures for Malaria in 2021-22 as well as in the planning of COVID vaccination outreach and micro-planning. In addition, the Cholera Unit of the MoH has used population and other geodata to model Cholera risk hotspots. There is interest from the EPI Department to continue using population geodata to make maps for micro-planning for other campaigns beyond COVID-19. HISP South Africa’s work with facilities in Chinsali district shows the potential of combining geospatial population estimates with DHIS2 data and analytics tools to strengthen local planning, monitoring and supervision, as well as facilitate the accurate use of existing tools to support EPI programs, such as the Bottleneck Analysis, Scorecard and Action Tracker apps, which are currently underutilized due to issues with population and other data.
This article is based on reports provided by HISP South Africa on their work in Chinsali District, Zambia. Additional information on using advanced population calculation and mapping tools in DHIS2 is available in our DHIS2 for Immunization webinars on Micro-planning and Advanced Population Mapping.