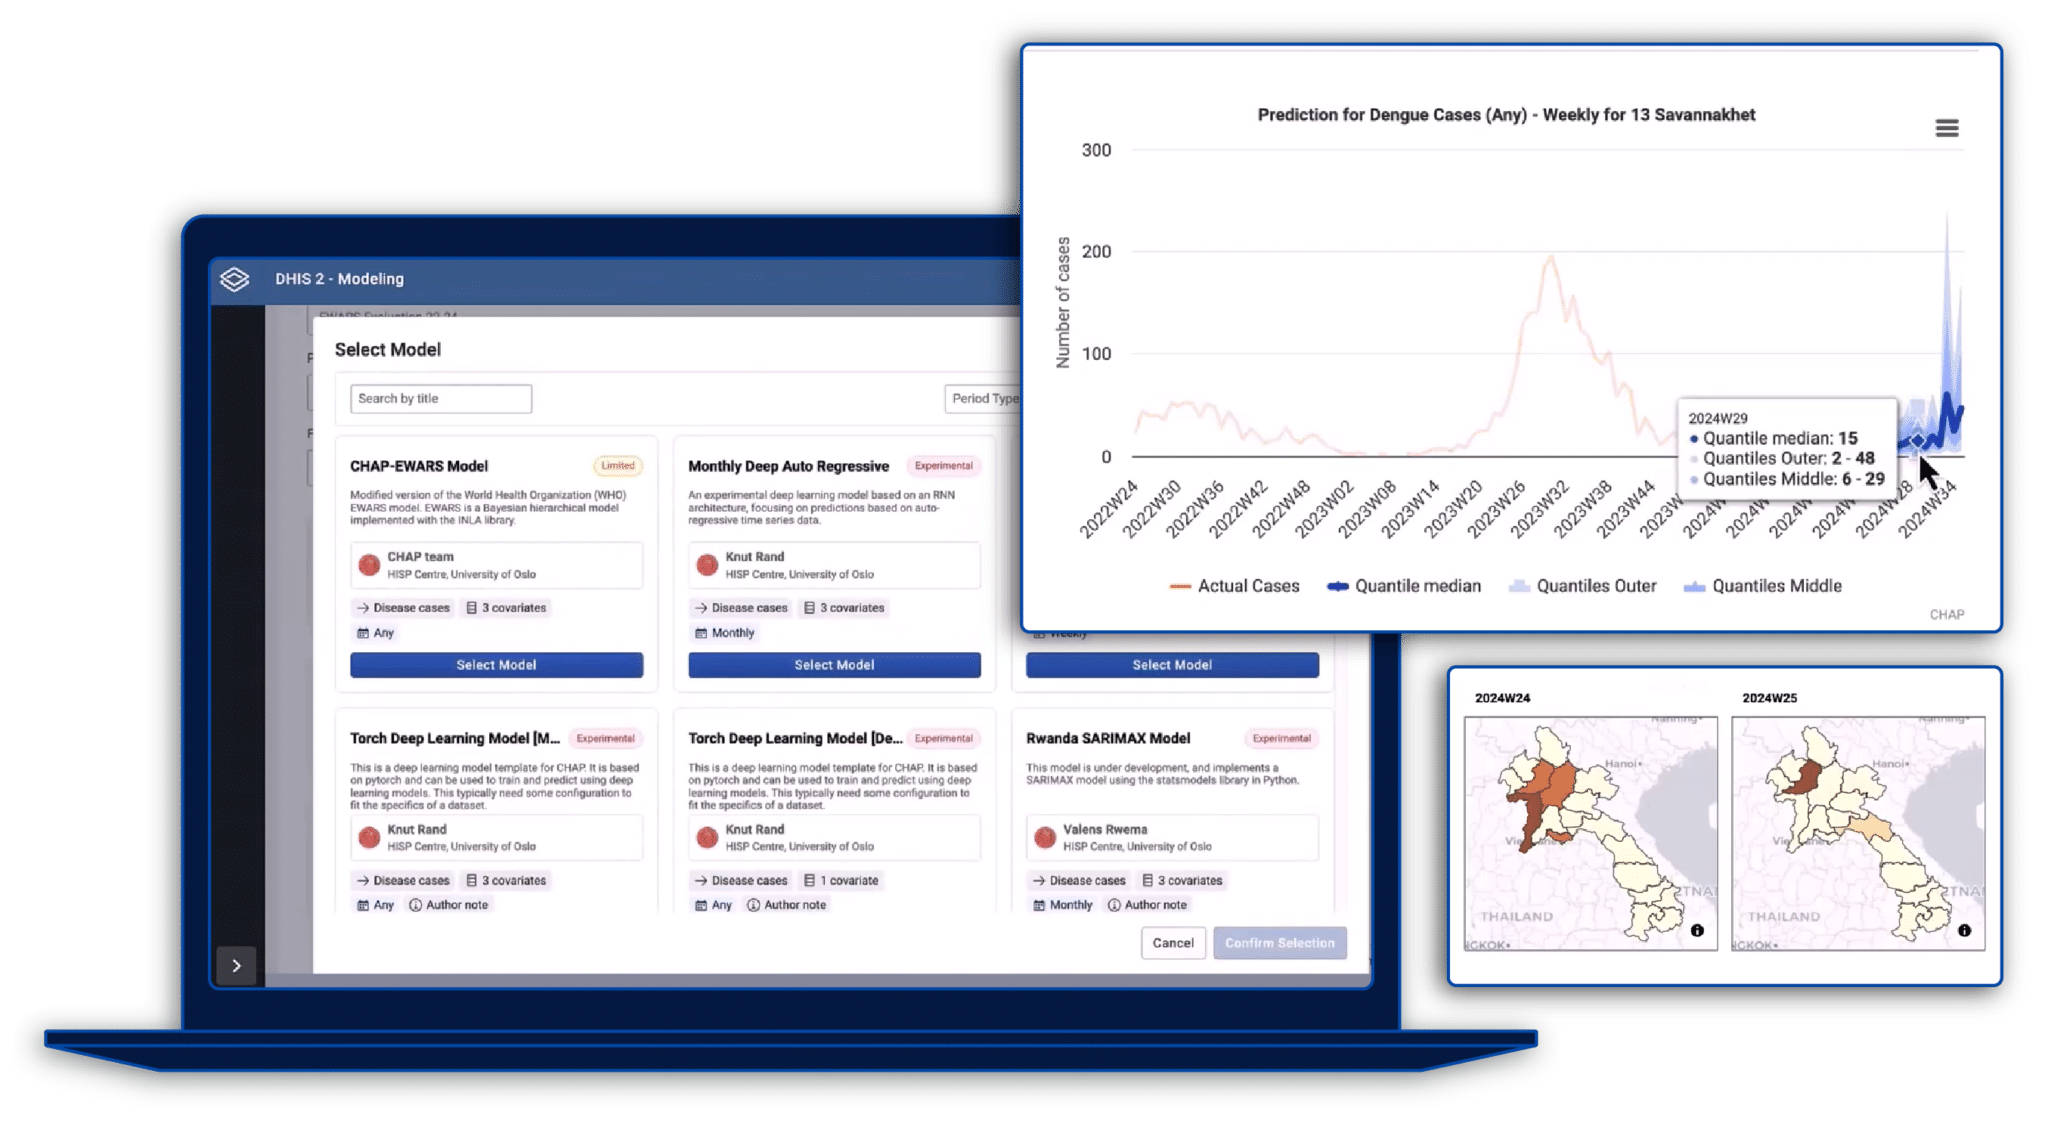
Through the Modeling App’s intuitive user interface, DHIS2 users can select from all of the models that are available in Chap, including predictive models from leading researchers worldwide, or to build and configure custom models tailored to the local context. Users can select covariates and connect models seamlessly to DHIS2 data.
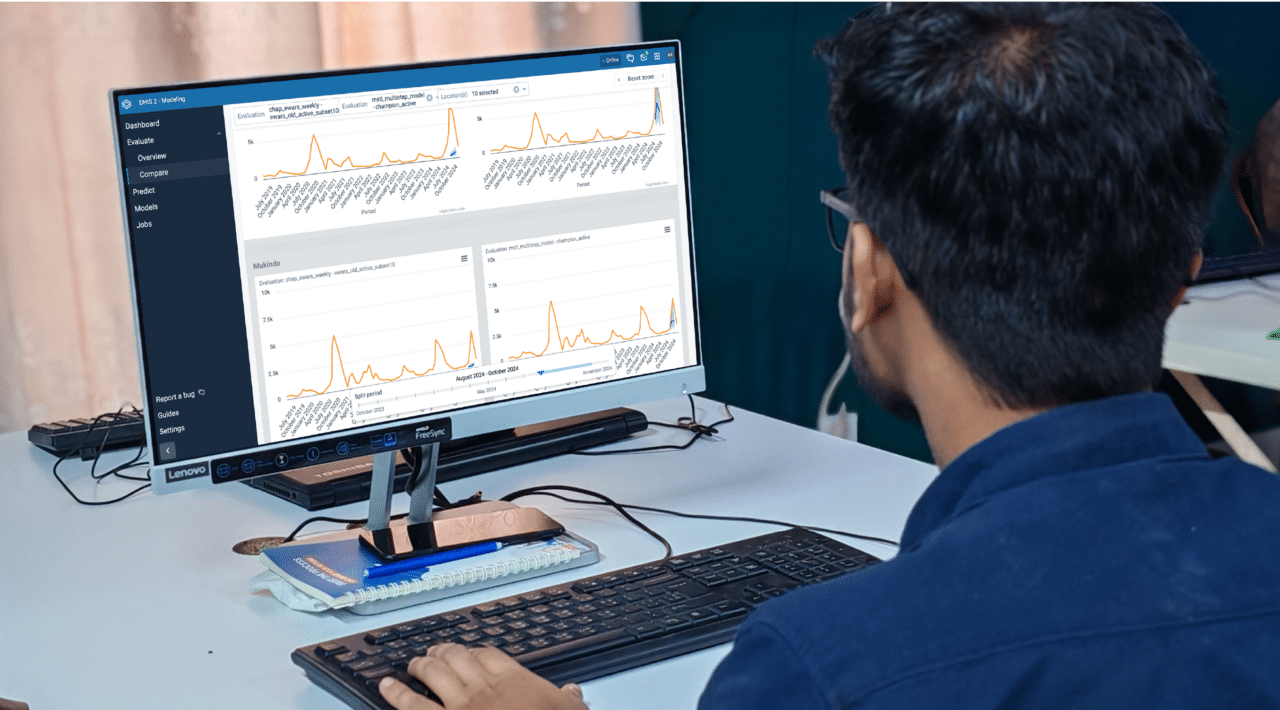
With the app’s evaluation feature, users can backtest model performance against historical data, to assess how effective the model is at predicting trends. The app displays probability ranges for each prediction, giving a visual indication of how certain or uncertain a forecast is. The app also allows you to compare multiple models side by side.
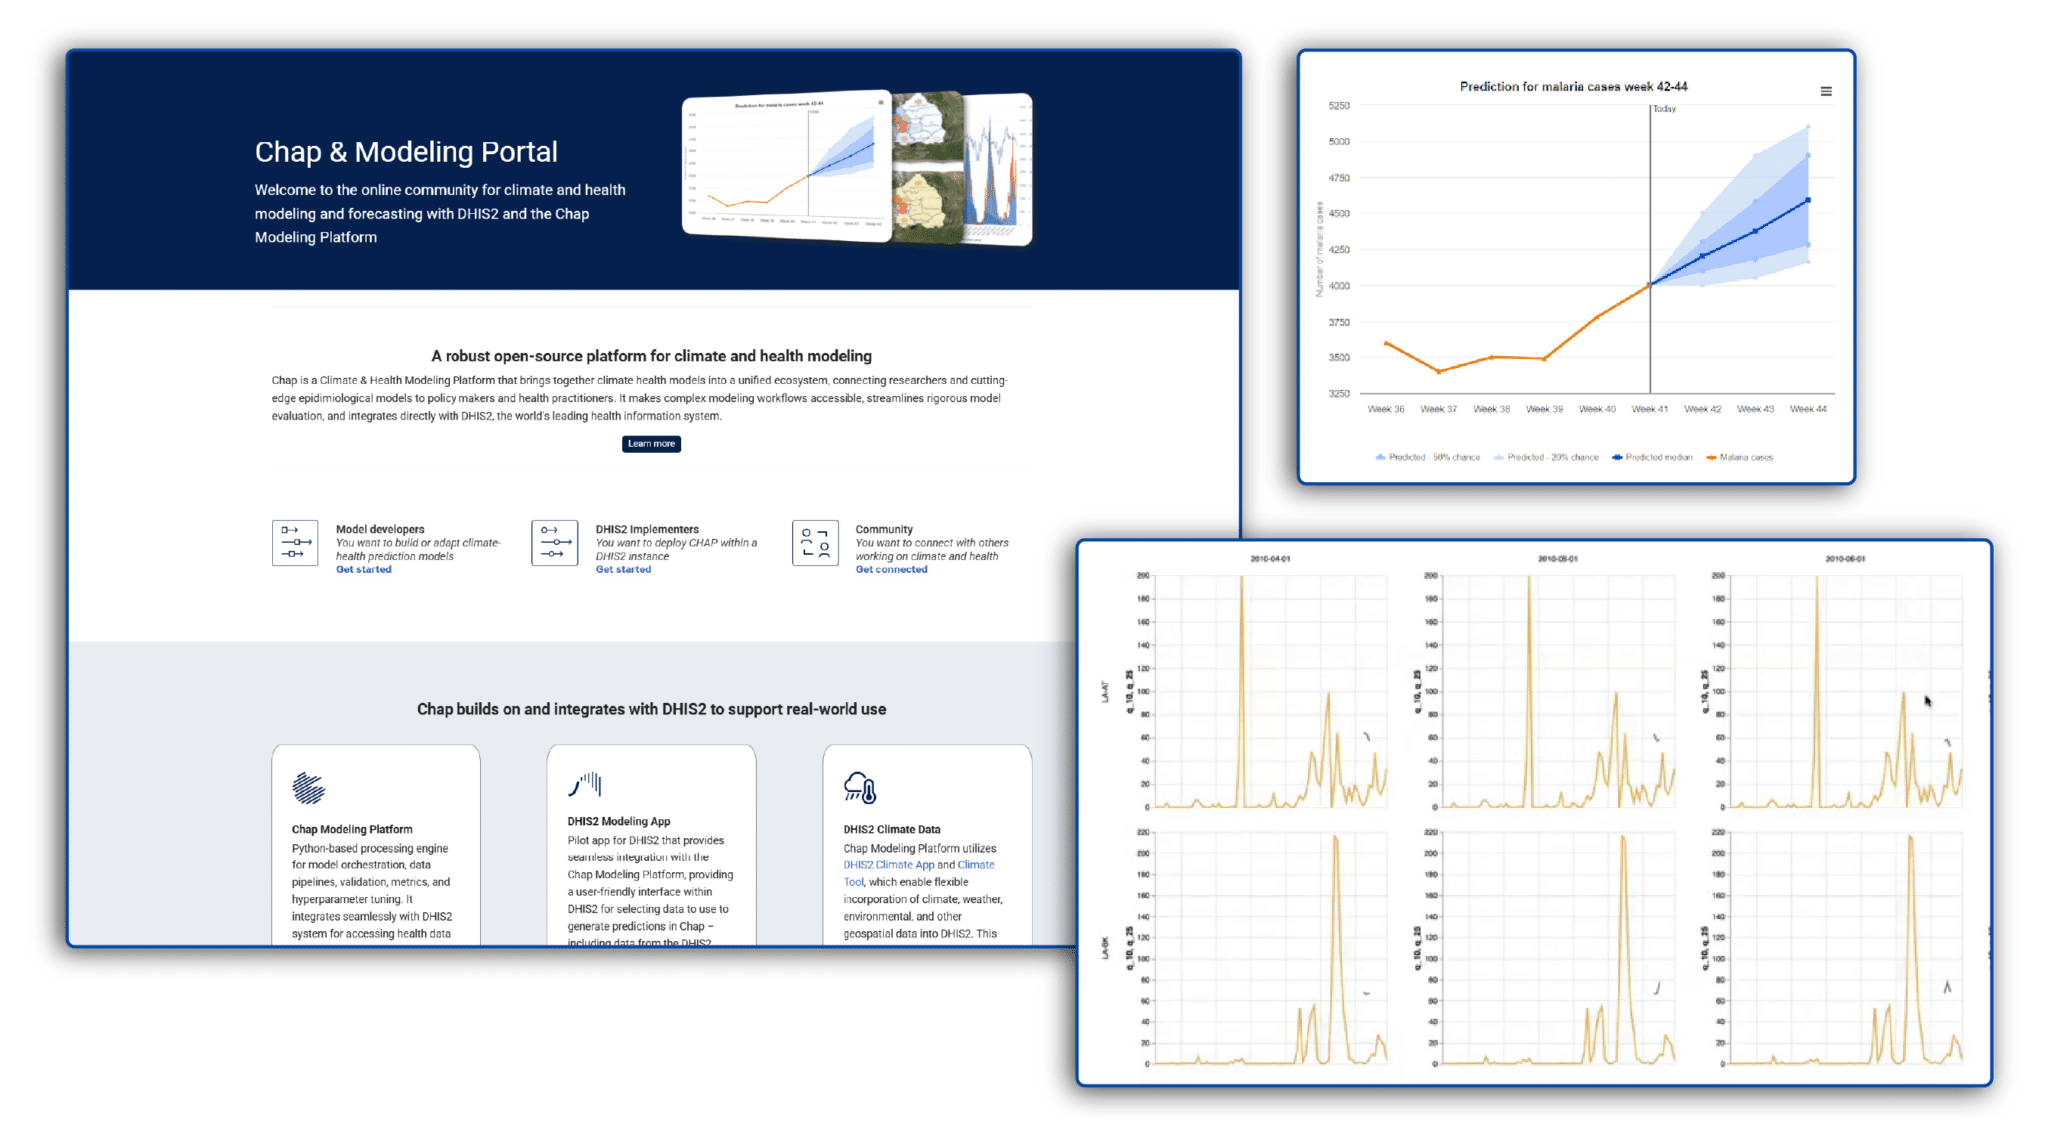
Once a model has been evaluated and validated, you can use the Modeling App to generate future predictions. These forecasts can be run for different time periods and geographic scales, such as three-month, district-level forecasts. Within the app, you can easily switch between viewing these results as a table, chart, or map, helping to identify which regions are at greatest risk for a given month. These outputs can then be seamlessly integrated into DHIS2 dashboards and configured to generate alerts when forecasts exceed locally defined thresholds.
Learn more & download